- What Is Cognitive Load in UX Design?
- Understanding the 3 Types of Cognitive Load
- How Cognitive Load Affects User Experience
- 7 Practical Ways to Reduce Cognitive Load in UX Design
- How to Measure Cognitive Load in UX Testing
- Common UX Design Mistakes That Increase Cognitive Load
- Frequently Asked Questions About Cognitive Load in UX
- Final Thoughts


What Is Cognitive Load in UX Design? 7 Ways to Reduce It
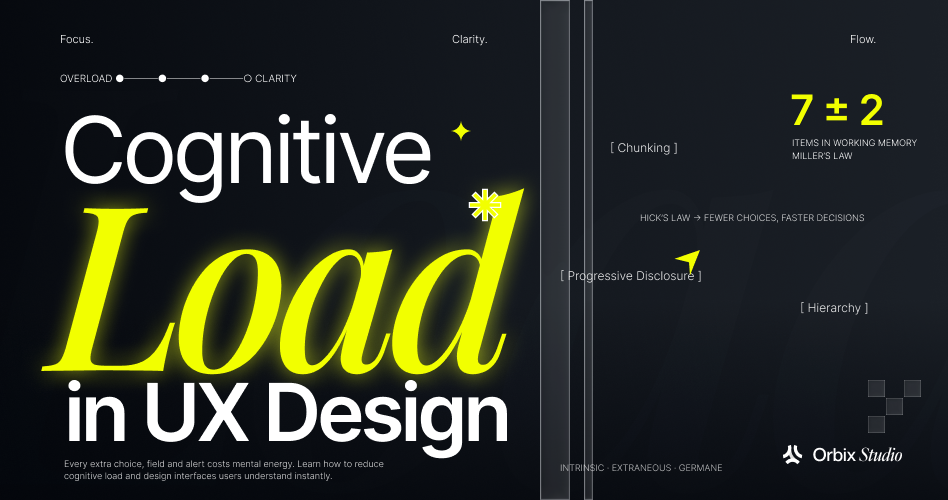
- Cognitive load refers to the mental effort users need to process information and complete tasks.
- Intrinsic, extraneous, and germane cognitive load explain different sources of mental effort during interactions.
- Extraneous cognitive load is where UX designers have the most opportunity to improve usability by removing unnecessary complexity.
- Chunking, progressive disclosure, and visual hierarchy help users process information without feeling overwhelmed.
- Recognition is easier than recall. Use visible options, familiar patterns, and contextual guidance instead of making users remember information.
- Consistent interactions, sensible defaults, and fewer unnecessary decisions make complex interfaces easier to navigate.
Have you ever opened an app and struggled to figure out where to start? Maybe there were too many buttons, or too much information competing for your attention.
This often happens when an interface demands more mental effort than a task should require. In UX design, this is known as cognitive load. It refers to the mental effort users need to process information, understand an interface, and complete an action.
Every user has a limited capacity to process information at once. When an interface presents too many choices, or uses unfamiliar interactions, users have to think harder to understand what to do next. This can make even simple tasks frustrating.
In this guide, we'll explore what cognitive load means in UX design, its 3 main types, and 7 practical ways to reduce it.
What Is Cognitive Load in UX Design?
Cognitive load is the mental effort people need to understand information and complete a task. In UX design, it describes how much thinking users must do to navigate an interface and figure out what to do next.
Nielsen Norman Group defines it as "the amount of mental resources that is required to operate the system" in its guide to minimizing cognitive load.
This mental effort is closely connected to working memory. Think of working memory as a small mental notepad. It temporarily holds information while we make decisions or complete tasks.
However, it has limited capacity. Psychologist Nelson Cowan's 2001 research review suggests that people can actively hold around four meaningful chunks of information at once.
For example, a user might struggle with a dashboard that uses unfamiliar terms, hides important filters, and displays too many competing metrics. They must spend extra effort understanding the interface before they can even focus on their actual task.
But, the same interface can feel equally difficult to everyone. An experienced user may understand technical terms and recognize familiar patterns immediately. A beginner might need more time to understand the same information. This is because existing knowledge helps people process new information more easily.
Understanding the 3 Types of Cognitive Load
Cognitive load theory traditionally describes three types of mental effort: intrinsic, extraneous, and germane. Each comes from a different part of the user experience.
For UX designers, the goal is to reduce unnecessary effort while helping users handle complex tasks and understand how a product works.
1. Intrinsic Cognitive Load
Intrinsic cognitive load is the mental effort required to complete a task. It depends on how many pieces of information users need to understand together and how familiar they are with those concepts.
For example, imagine a user comparing activation rates across 2 device types: mobile and desktop. They need to understand the activation metric, select both device types, choose a reporting period, and interpret the results. These steps depend on one another, so the task has some built-in complexity.
A beginner might struggle with this process, while an experienced product analyst could complete it quickly. The task is the same, but their existing knowledge changes how difficult it feels.
Designers can't eliminate intrinsic load without changing the task itself. However, they can make it easier to manage. Use familiar terminology, provide short explanations for technical metrics, and break complex workflows into smaller steps.
2. Extraneous Cognitive Load
Extraneous cognitive load comes from the way information is presented or how an interface works. Unlike intrinsic load, it doesn't help users complete their tasks. It simply makes them work harder.
Consider an analytics dashboard with 4 common usability problems:
- Vague labels that make metrics difficult to understand.
- Important filters hidden behind multiple menus.
- Related controls scattered across different sections.
- Missing feedback that leaves users unsure whether an action worked.
Each problem adds unnecessary effort. For example, if a user selects a reporting period but the date range disappears when they open another tab, they must remember their previous choice. Keeping the selected date range visible would remove that extra effort.
This is where UX designers have the greatest opportunity to improve the experience. Clear labels, predictable navigation, visible context, and immediate feedback help reduce unnecessary mental effort.
However, a cluttered screen doesn't automatically prove that users experience high cognitive load. Usability testing helps identify which design decisions actually make tasks harder.
3. Germane Cognitive Load
Germane cognitive load traditionally describes the mental effort people spend understanding information and building useful knowledge. Rather than simply completing a task, users are learning how different parts of a product work together.
For example, imagine a user learning a reporting tool for the first time. They discover that creating every report follows the same 4 steps:
- Choose a metric.
- Add filters.
- Select a time range.
- Save the report.
After completing the workflow a few times, users begin recognizing the pattern. They no longer need to figure out every step from scratch. Their understanding makes future interactions easier.
UX designers can support this learning through consistent interactions, helpful onboarding, contextual guidance, and familiar patterns.
How Cognitive Load Affects User Experience
Cognitive load affects how easily people understand an interface, how many mistakes they make, and whether they finish their task. When a task's mental demands stay within what a user can handle, the experience feels smooth. When they go beyond it, users get confused, slow down, or give up.
Cognitive Load vs. Cognitive Overload
Cognitive load is the mental effort a task requires. Cognitive overload happens when that effort is more than a specific person can handle for a specific task at that moment.
The two terms aren't interchangeable. Every task has some load. Overload is the point where the load stops being manageable.
For example, an experienced analyst builds a device comparison report in a few minutes. The task has a real load, but it's manageable. A new user facing the same screen, with unfamiliar terms and hidden filters, may feel lost and abandon the report. Same interface, same task, but only one person is overloaded.
How Mental Demands Can Affect Understanding, Errors, and Task Completion
When an interface asks for too much unnecessary effort, you may see signs like these:
- Users pausing or re-reading labels
- Going back to earlier screens to check settings
- Choosing the wrong option
- Taking longer than expected
- Leaving a task unfinished
For example, a user might click back to the filter panel twice to check which device types they selected. That backtracking is a clue that the interface asked them to remember something it could have shown.
These signs are only possible signals. Errors or slow completion can have many causes, such as a bug, a slow connection, or an unclear goal. The measurement section later in this guide explains how to check what's really going on.
7 Practical Ways to Reduce Cognitive Load in UX Design
You can reduce cognitive load by grouping information around tasks, making priorities clear, showing information instead of making users remember it, revealing complexity gradually, using familiar words and patterns, keeping feedback visible, and offering helpful guidance and defaults. Each method below explains how it works, shows it in the report builder, and names a trade-off to watch.
1. Group Related Information into Meaningful Sections
Grouping puts things that belong together in one place, so users don't have to piece them together. It works because people can treat a group as one chunk instead of many separate items.
In the report builder, put the metric, device filters, and date range in a "Report settings" group, and output controls like save and export in another. Group by what users are trying to do, not by how the database is built. Orbix's guide to information architecture in UX goes deeper into organizing categories and labels.
Trade-off: Grouping isn't the same as visual hierarchy, and your groups need to match what users expect. Test the group names with real people.
2. Create a Clear Visual Hierarchy
Visual hierarchy uses size, color, contrast, and position to show what matters most. It tells users where to look first, so they don't have to work it out.
Make "Save report" the one clear primary button. Show the chart and its current settings next. Give advanced controls a quieter style.
Trade-off: If you make everything bold, nothing stands out. Aim for one main action per screen where you can.
3. Favor Recognition Over Recall
Recognition means seeing something and knowing it. Recall means pulling it from memory with no clues. NN/g explains that recognition is easier than recall because visible cues help people remember.
Keep the applied filters and date range visible above the chart. Show recently used reports instead of asking users to type report names from memory.
Trade-off: Showing more information can create clutter. Show what the current step needs, not everything at once.
4. Use Progressive Disclosure Carefully
Progressive disclosure shows the most common options first and reveals advanced ones only when users ask for them. NN/g's article on progressive disclosure notes that the hard part is getting the right split between first-view and secondary features.
In the report builder, keep metric, devices, and date range in view. Put options like custom segments behind an "Advanced options" link.
Trade-off: If you hide choices that affect each other, users may miss something important. Don't hide anything they need to compare or check right now.
5. Use Familiar Patterns and Clear Language
Familiar patterns, like a date picker that works like other date pickers, let users rely on what they already know. Clear words save them from guessing.
Name metrics the same way everywhere. Add short help text to "Activation rate," such as "The share of new sign-ups who finished setup." Your product's exact definition will differ. Orbix's guide to clear UX writing for SaaS interfaces covers labels, microcopy, and consistency in detail.
Trade-off: One convention doesn't suit every group. An expert analytics audience may expect technical terms that would confuse beginners.
6. Keep Important Choices and System Feedback Visible
Users need to see two things: what they've chosen and what the system did. The first supports recognition. The second is feedback.
Show a persistent summary of the current selections. After saving, show a specific message tied to the actual report, like "Device Activation Comparison saved," and make the report appear in the saved list.
Trade-off: Feedback should be clear but not noisy. A pop-up for every small change adds its own load.
7. Provide Contextual Guidance and Helpful Defaults
Contextual guidance gives help at the moment users need it, instead of in a separate help center. Defaults give users a sensible starting point, so they have fewer decisions to make.
When a user opens the report builder, the date range might default to "Last 30 days" and the device filters to "All devices," both easy to change. A small tooltip can explain unfamiliar metrics without a long tutorial.
Trade-off: Defaults must be visible and easy to change. A hidden default that users don't notice can lead to wrong conclusions.
Before you redesign, diagnose by task. It helps to write down what you see, task by task, and keep guesses separate from evidence. Here's a simple diagnosis matrix using the hypothetical report task:
If your team wants a second set of eyes on a complex product, Orbix Studio's UI/UX design services include UX audits, UX research, and usability testing for B2B and SaaS products.
How to Measure Cognitive Load in UX Testing
No single test directly measures cognitive load. UX teams usually combine what users say about their effort (subjective measures) with what users do (performance measures). A systematic review of 76 studies by Darejeh and colleagues, which includes cognitive load researcher John Sweller, compares these methods and offers a framework for choosing between them.
Subjective Mental Effort and NASA-TLX
Subjective measures ask people to rate how hard a task felt. The best-known tool is the NASA Task Load Index (NASA-TLX), which NASA describes as a subjective, multi-dimensional workload assessment tool. It asks people to rate six dimensions:
- Mental demand
- Physical demand
- Temporal demand (time pressure)
- Performance
- Effort
- Frustration
For example, after a participant builds the "Device Activation Comparison" report, they rate each dimension. The ratings show how demanding the task felt to them.
Use these scores carefully. NASA-TLX measures perceived workload, not brain activity, and workload is broader than cognitive load. A 2025 review by Babaei and colleagues found serious issues in how HCI research applies NASA-TLX and recommended caution when using it in user studies.
Task Success, Completion Time, and User Errors
Performance measures look at what users actually do. Decide what you'll measure before the test starts:
- Task success: Did the user save the right report, with mobile and desktop selected and the previous 30 days set?
- Errors: Did they pick the wrong metric or the wrong device?
- Backtracking: How often did they return to earlier screens to check settings?
- Time on task: How long did it take from start to save?
These numbers are useful, but they don't tell the whole story. Faster completion alone never proves that cognitive load went down. A user might be faster because they practiced the task, because the instructions were clearer, or because they skipped a step by mistake.
How to Evaluate a Cognitive-Load Redesign Responsibly
To judge whether a redesign reduced unnecessary effort, compare the old and new versions under fair conditions and combine more than one kind of evidence.
A responsible comparison usually includes:
- The same task in both versions, with the same instructions
- Similar participants, with experience levels recorded, since beginners and experts react differently
- Balanced order, so half the participants see Version A first and half see Version B first, which reduces learning effects
- Both workload ratings and performance measures, not just one
- Other explanations, such as bugs, wording changes, or a small sample, checked before you draw conclusions
An expert review can point out likely problems first. Orbix's guide to the UX audit process explains how audits, heuristic reviews, and real-user testing fit together. Still, an audit alone can't prove that cognitive load decreased. You need to test with real users.
Here's an illustrative study plan for the report builder. It describes what a team could do. No participants or results are included, because this study hasn't been run.
Common UX Design Mistakes That Increase Cognitive Load
Most extra cognitive load comes from a few repeat mistakes: too many things competing for attention, unclear words, making users remember things, and hiding feedback. Each one is easy to miss when you already know the product well.
Too Many Competing Elements and Unclear Visual Priorities
When everything on a screen looks equally important, users have to work out what to look at first. That sorting takes effort before they can even start the task.
Picture a report builder with six buttons in one row: "Save," "Export," "Schedule," "Share," "Duplicate," and "Advanced settings." They're all the same size and color. A user who only wants to save the report has to scan all six.
This connects to Hick's Law, which describes how decision time grows as the number of choices grows. Orbix's guide to UX laws every designer should know explains it with more examples. Still, a busy screen isn't automatically a bad one. Visual density alone isn't a proven measure of load, and experts who use a tool every day may want more options in view.
Unclear Labels and Unfamiliar Navigation
Users spend effort figuring out what a label means and where things live. If two menu items sound alike, or a section uses an internal team name, people have to guess.
In an analytics tool, labels like "Users," "Active users," and "Engaged users" might sit side by side with no explanation. A beginner can't tell which one they need. The same problem shows up in navigation when sections are named after features instead of tasks, or move around between screens.
Orbix's guide to SaaS navigation design principles shows how clear labels and a predictable structure make products easier to move around.
Forcing Users to Remember Information Across Screens
Every time users must carry information from one screen to another in their head, working memory has more to hold.
For example, a user sets the date range to "Last 30 days" and picks "Mobile" and "Desktop" as filters. Then they open a separate settings tab to rename the report. When they come back, nothing shows which filters are applied. They must remember, or go back and check.
Not every screen change is a problem. Splitting a long task into steps can help. The issue is when the next step depends on information the interface stops showing.
Hiding Important Information or Feedback
Users need to know what state the system is in. Which filters are on? Did my report save? Nielsen Norman Group calls this visibility of system status, and it's one of the best-known usability heuristics.
Imagine a user clicks "Save" and nothing visibly changes. No message, no updated title, no new entry in the report list. They'll likely click again, check the list, or wonder if their work was lost.
Hiding things isn't always wrong. Progressive disclosure, covered below, hides advanced options on purpose. The mistake is hiding what users need to see right now.
SaaS Dashboard Example: Building a Product-Usage Report
This is a hypothetical example written to show how the ideas above fit together. It is not based on a real client project, test, or study.
The task: A product manager wants to compare activation rates for mobile and desktop users over the previous 30 days, then save the report as "Device Activation Comparison."
Necessary demands (intrinsic load): Understanding what activation rate means, choosing the right device types and date range, and reading the comparison.
Possible unnecessary demands in Version A (extraneous load):
- "Activation rate" and "Activated users" appear side by side with no explanation.
- Device filters sit in a separate panel from the date picker.
- The date range disappears when the user opens the chart settings tab.
- Six equal-weight action buttons compete with "Save."
- Applied filters aren't shown above the chart.
- Saving shows no confirmation.
Proposed Version B:
- A short help tip explains activation rate.
- Device and date controls sit together in one "Report settings" group.
- A summary bar above the chart always shows "Mobile vs. Desktop, Last 30 days."
- "Save report" is the clear primary button, and less common actions move into a "More" menu.
- After saving, a message names the report: "Device Activation Comparison saved."
The trade-off: Moving actions into a "More" menu may help new users, but power users who export often could find it slower. The team might keep "Export" visible if usage data shows people use it a lot.
What to test: Whether users can build and save the correct report, how often they backtrack to check filters, how much effort they report, and whether experienced users are slowed down by Version B.
Frequently Asked Questions About Cognitive Load in UX
Is Lower Cognitive Load Always Better?
No. Some mental effort is the point of the work, like analyzing data or learning a new tool. The goal is to remove avoidable effort caused by the design, not to remove thinking. An analyst comparing activation rates should still think hard about what the numbers mean.
Can a Visually Simple Interface Still Be Mentally Demanding?
Yes. A clean, minimal screen can still hide important information. For example, a minimal dashboard that tucks applied filters out of sight forces users to remember them. Simple looks and simple use are not the same thing.
How Does Prior Knowledge Change Cognitive Load?
People who already understand a tool's concepts need less effort to use it, so the same screen can feel easy to one person and hard to another. In practice, design for the least experienced users you need to support, and offer shortcuts for experts.
Does Hick's Law Mean Designers Should Always Show Fewer Choices?
No. Hick's 1952 experiments measured how reaction time grew with the number of choices in a lab setting. They don't set a maximum number of menu items. Organize choices around user tasks and needs instead of cutting them to an arbitrary number.
Can Usability Testing Prove That Cognitive Load Has Decreased?
Not on its own. Testing gives evidence, not proof. Your evidence is stronger when you compare similar tasks and participants, combine workload ratings with performance data, and rule out other explanations.
Final Thoughts
Cognitive load is part of every task. Some of it comes from the work itself, and some comes from the way an interface is built. Your job as a designer is to keep the necessary effort, support learning, and remove the avoidable effort that slows people down.
Start with one real task, write down where users might struggle, try a fix, and test it fairly. Over time, those small, careful changes add up to products people find easier to use.