- Quick Comparison of the Best Heatmap Tools
- Why Use Website Heatmap Tools?
- Heatmap Tools vs. Google Analytics: Does GA4 Have Heatmaps?
- 10 Best Heatmap Tools to Analyze Website User Behavior
- Free Heatmap Tools: What Each Free Plan Includes
- Best Hotjar Alternatives
- What Are the Different Types of Heatmaps?
- How to Choose the Right Heatmap Tool
- Frequently Asked Questions
- Final Thoughts


10 Best Heatmap Tools to Improve Website User Experience in 2026


- Heatmaps reveal where visitors click, scroll, and interact with website elements. They help identify engagement patterns that traditional analytics may overlook.
- Click heatmaps show which buttons, links, and page elements attract interactions. Use them to identify ignored CTAs and misleading clickable elements.
- Scroll heatmaps reveal how far visitors move down a page. Use this data to determine whether important content appears too far below the fold.
- Session recordings complement heatmaps by showing how visitors navigate, hesitate, and interact with individual elements.
- Rage clicks, dead clicks, and repeated interactions can indicate usability problems. Investigate these patterns to identify potential friction points.
- No single heatmap tool fits every website. Compare recording limits, heatmap types, integrations, pricing, and privacy controls before choosing one.
- Free heatmap tools like Microsoft Clarity cover the basics for most websites. Paid heatmap software adds A/B testing, form analytics, and higher session limits.
- Heatmap data shows what users do, not why they do it. Combine behavioral insights with user feedback and usability testing before making design decisions.
Knowing how many people visit your website isn't enough to understand their experience. You also need to know which elements attract attention, where visitors click, and how far they scroll before leaving.
A heatmap tool is software that shows where visitors click, scroll, and move on a page as a color-coded map. Website heatmap tools help answer these questions by turning visitor interactions into visual data. You can use these insights to identify overlooked CTAs, confusing navigation, and sections that fail to engage visitors.
However, not every tool offers the same capabilities. Some focus on basic click and scroll tracking, while others combine heatmaps with session recordings, form analytics, and conversion rate optimization (CRO) features.
We've reviewed 10 website heatmap tools to compare what they offer, how much they cost, and which teams can benefit most from each platform. If you are comparing Hotjar alternatives, this list also works as a guide to the best Hotjar alternatives for different budgets and needs.
Quick Comparison of the Best Heatmap Tools
Choosing a heatmap tool depends on your website, analytics needs, and budget. Some tools focus on click and scroll tracking, while others offer session recordings, form analytics, and conversion optimization. Here's a quick comparison of 10 popular user behavior analytics tools with heatmaps, so you can shortlist the best heatmap software for your needs.
Which heatmap tool is best? It depends on your goal. Microsoft Clarity is the best starting point if you want a free heatmap tool with no traffic limits. Crazy Egg, Inspectlet, and Zoho PageSense suit teams that want A/B testing. Lucky Orange and Heatmap suit online stores, while Contentsquare and FullStory suit larger teams and SaaS products.
Why Use Website Heatmap Tools?
Website heatmap tools help you understand how visitors interact with your website. As UX analytics tools, they reveal usability problems, highlight overlooked elements, and show where your pages need improvement. Here are the key benefits of using them.
1. Identify ignored CTAs and page elements: Find buttons, links, and important sections that visitors overlook. Use these insights to improve their placement, visibility, and design.
2. Understand visitor scrolling behavior: See how far visitors scroll and which sections receive less attention. Use this data to position important content where visitors are more likely to see it. In a Nielsen Norman Group eye-tracking study, people spent about 57% of their viewing time above the fold and 74% in the first two screens.
3. Detect usability issues: Use click tracking tools to identify dead clicks, rage clicks, and repeated interactions that may indicate broken elements, confusing navigation, or unresponsive buttons.
4. Improve landing page conversions: Discover which page elements attract interactions and which ones visitors ignore. Use these findings to improve layouts, messaging, and CTA placement. If you work on SaaS pages, our SaaS landing page examples show how other teams structure theirs.
5. Optimize mobile user experience: Understand how visitors interact with mobile menus, buttons, forms, and other interface elements. Identify layout and interaction problems that affect smaller screens. Google research found that 53% of mobile visits are abandoned if a page takes longer than 3 seconds to load, so small layout and speed problems add up fast. For app screens, see our mobile app UX design guide.
6. Make data-driven design decisions: Use actual visitor interaction data to support design improvements instead of relying entirely on assumptions. Combine heatmap insights with analytics and user feedback for better decisions. A heatmap that shows ignored CTAs also makes a UX audit report easier to defend, as these UX audit report examples show.
Heatmap Tools vs. Google Analytics: Does GA4 Have Heatmaps?
Traditional website analytics tools like Google Analytics 4 (GA4) track traffic, user activity, and conversions. Heatmap tools take a more visual approach, showing where visitors click, how far they scroll, and which page elements attract interactions.
Does Google Analytics have heatmaps? No. Many people search for a website heatmap Google Analytics setup, but GA4 does not include a built-in heatmap, so you cannot see a click map or scroll map inside it. To get a website heatmap with Google Analytics data, connect GA4 to a heatmap tool. For example, Microsoft Clarity integrates with Google Analytics, so you can match heatmaps and recordings with your GA4 traffic data.
Heatmap tools are user behavior analytics tools, so they serve a different purpose than GA4. Using them together gives you a better understanding of website performance
You can use both heatmaps and Google Analytics together. For example, GA4 might reveal that your pricing page receives 5,000 visits but generates few demo requests. A heatmap can help you investigate whether visitors overlook the demo CTA, fail to reach the pricing section, or interact with other elements instead.
10 Best Heatmap Tools to Analyze Website User Behavior
The right heatmap tool helps you understand how visitors interact with your website. Below, we compare 10 of the best user behavior analytics tools that include heatmaps, based on their features, pricing, strengths, and limitations to help you find the best option for your needs.
1. Microsoft Clarity: Free Website Heatmaps and Session Recordings
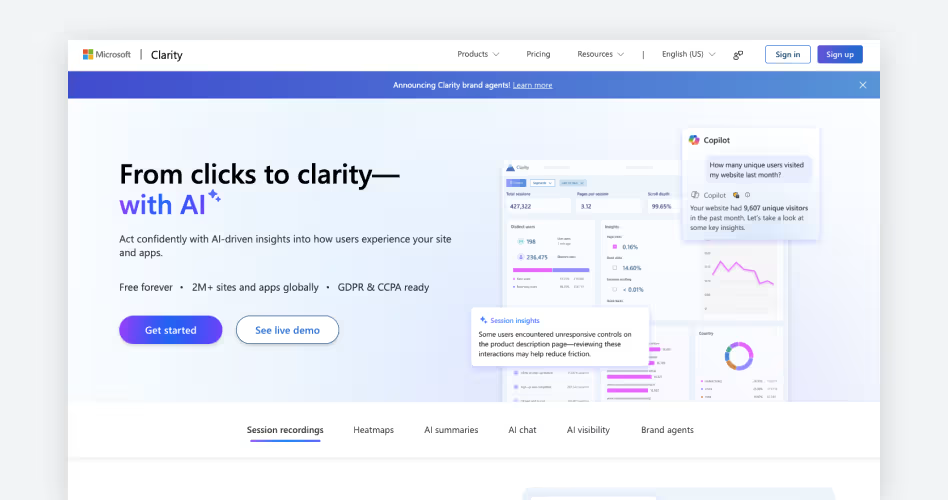
Best for: Free website behavior analytics
Microsoft Clarity is Microsoft's free heatmap tool, and it works for both websites and apps. It combines heatmaps, session recordings, and AI-powered insights to help you understand how visitors interact with your pages. Its biggest advantage is simple: you get its core features without paying or worrying about traffic-based pricing limits.
Key Features of Microsoft Clarity
- Click, scroll, and attention heatmaps: See which page elements attract clicks, how far visitors scroll, and where they spend time. Area heatmaps show click activity within selected sections. Conversion heatmaps are also available for Shopify stores.
- Session recordings: Replay visitor sessions to see how people navigate pages, interact with elements, and encounter problems. Use filters to find sessions that match specific behaviors.
- Friction signals: Find rage clicks, dead clicks, quickbacks, and JavaScript errors. These signals help you spot interactions that may frustrate visitors.
- AI-powered Copilot: Get summaries of recordings and heatmaps, or ask questions about your website data. Check its suggestions against the actual reports before making changes.
- Google Analytics integration: Connect Clarity with Google Analytics to compare visitor behavior with traffic and performance data. It's the easiest way to add a website heatmap to your Google Analytics reporting.
- Mobile app support: Clarity also offers a lightweight SDK for Android and iOS apps, so you can see tap heatmaps and session replays inside your app.
Microsoft Clarity Pricing
Microsoft Clarity offers its core features for free, with no paid subscription or traffic-based charges.
Pros and Cons of Microsoft Clarity
Should You Choose Microsoft Clarity?
Microsoft Clarity is a strong choice if you want a free heatmap analytics tool with session recordings and visitor behavior insights, without traffic limits. It's particularly useful for startups, small businesses, and marketing teams. However, if you need built-in A/B testing or advanced product analytics, consider pairing it with another tool. It's also one of the best free Hotjar alternatives for sites that outgrow Hotjar's free session limits.
2. Contentsquare: Enterprise UX Analytics and Customer Journey Analysis
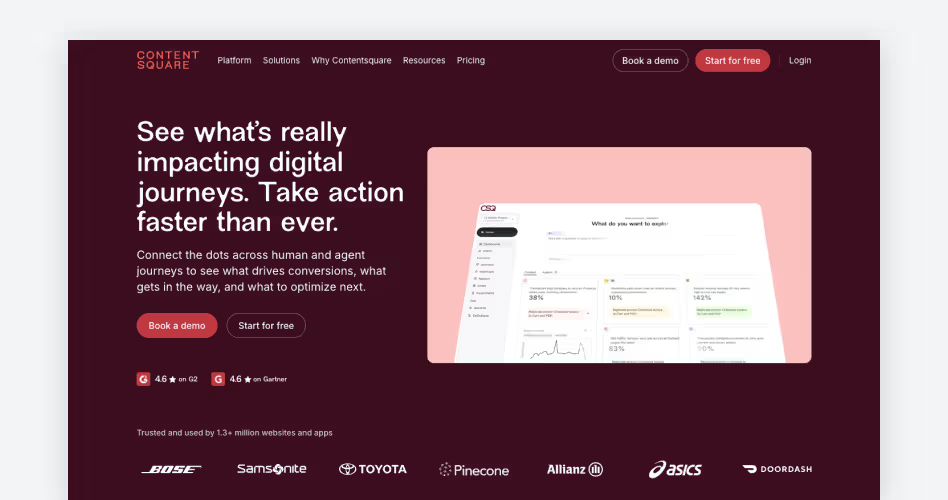
Best for: Understanding complex customer journeys across websites and apps
Contentsquare is a digital experience analytics platform that helps businesses understand how customers interact with their websites and mobile apps. It combines heatmaps, session replays, journey analysis, funnels, and performance monitoring to reveal where visitors struggle and what affects conversions.
Its biggest strength is connecting individual page interactions with broader customer journeys and business outcomes. That makes it one of the best UX analytics tools for large teams.
Key Features of Contentsquare
- Zone-based heatmaps: Analyze clicks, engagement, and conversions across individual page elements. Identify which buttons, images, and content sections attract attention or drive sales.
- Session replay: Replay visitor journeys to investigate navigation problems, frustration, and unexpected interactions. You can also use AI-generated summaries to review sessions faster.
- Customer journey analysis: Visualize how visitors move between pages and identify where they abandon important journeys. This is especially useful for complex e-commerce and SaaS websites.
- Friction and error analysis: Identify rage clicks, dead clicks, JavaScript errors, and other issues that affect user experience. Connect these problems with session replays to investigate their causes.
- Form and funnel analysis: Understand where visitors abandon forms and conversion journeys. Identify problematic fields and steps that prevent users from completing important actions.
- Performance monitoring: Track Core Web Vitals and technical errors alongside user behavior to investigate how website performance affects the experience.
Contentsquare Pricing
Contentsquare offers a free plan and paid plans for businesses that need more advanced analytics. Growth starts at $39 per month with annual billing, while Pro and Enterprise require custom pricing. The cost of Growth depends on the monthly session volume you select.
Growth pricing starts at $39/month with annual billing ($49/month when billed monthly). Free-plan analytics collection is 100%, but session replay capture is limited to 5% of sessions, up to 10,000 monthly. Pro and Enterprise pricing depends on requirements. Source: Contentsquare official pricing. Checked November 2026.
Pros and Cons of Contentsquare
Should You Choose Contentsquare?
Contentsquare is a strong choice for mid-sized and enterprise businesses that need more than basic click and scroll heatmaps. Its journey analysis, zone-based reporting, and revenue insights help teams investigate complex customer experiences.
Smaller websites may find its advanced capabilities unnecessary. If you only need basic heatmaps and session recordings, a simpler tool may be more practical.
3. Crazy Egg: Heatmaps and Conversion Optimization
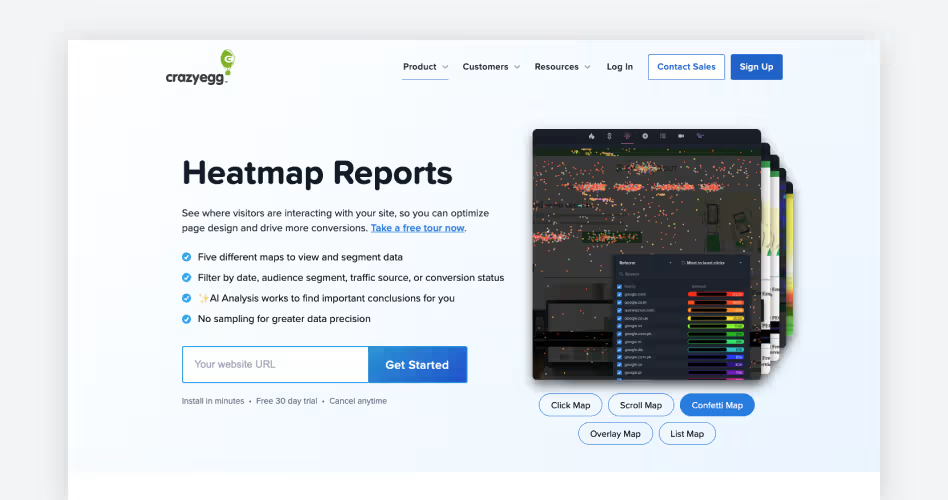
Best for: Improving landing page conversions
Crazy Egg is a website optimization platform that combines heatmaps, session recordings, web analytics, and A/B testing. It helps you identify which page elements attract clicks, where visitors lose interest, and which design changes improve conversions. Its main advantage is that you can analyze visitor behavior and test page improvements within one platform.
Key Features of Crazy Egg
- Click and scroll heatmaps: See where visitors click and how far they scroll, using click maps and scroll maps. Use these reports to identify ignored CTAs, distracting elements, and sections that need better placement.
- Confetti reports: Break down clicks by traffic source, device, browser, and other visitor attributes. This helps you understand how different audience segments interact with your pages.
- Session recordings: Watch individual visitor sessions to identify navigation problems, hesitation, and interactions that prevent conversions.
- A/B testing: Compare different page designs, headlines, and CTAs to find which version performs better. Crazy Egg includes a visual editor for creating experiments without writing code.
- Conversion tracking and funnels: Track important actions and identify where visitors leave before completing a conversion.
Crazy Egg Pricing
Crazy Egg offers a 30-day free trial across its plans. Paid subscriptions are billed annually, with pricing based on tracked pageviews, heatmap reports, and session recordings.
*Prices are displayed monthly but billed annually. All plans include a 30-day free trial. A/B testing is available on Plus, Pro, and Enterprise plans, not Starter. Source: Crazy Egg official pricing. Pricing checked November 2026.
Pros and Cons of Crazy Egg
Should You Choose Crazy Egg?
Crazy Egg is a good choice if you want to improve landing pages and test design changes using actual visitor behavior. Its combination of heatmaps, session recordings, and A/B testing makes it useful for marketers and conversion optimization teams.
However, check the monthly pageview and recording limits before choosing a plan, especially if your website receives high traffic.
4. Mouseflow: Website Behavior and Friction Analysis
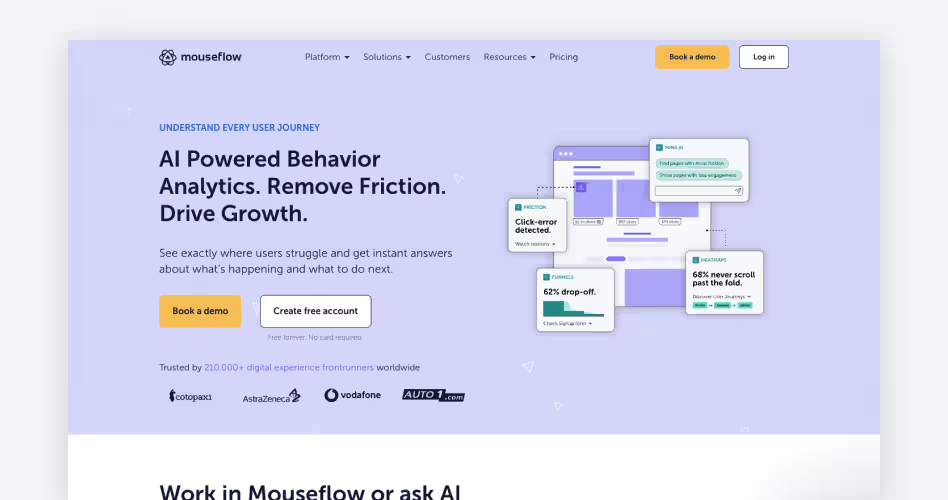
Best for: Finding usability problems and form abandonment
Mouseflow is a behavior analytics platform that helps businesses understand where visitors struggle on their websites. It combines heatmaps, session recordings, conversion funnels, and friction detection to identify problems affecting user experience.
Its standout feature is its ability to connect visitor interactions with friction signals, helping teams investigate why users abandon forms, struggle with navigation, or leave before converting.
Key Features of Mouseflow
- Website heatmaps: Track clicks, scrolling, and geographic activity to understand how visitors interact with individual pages. Advanced plans also include attention, movement, interactive, and friction heatmaps.
- Session recordings: Replay visitor sessions to see clicks, scrolling, navigation, and interactions. Use recordings to investigate problems identified in heatmaps and funnels.
- Friction detection: Automatically identify rage clicks, dead clicks, JavaScript errors, and other signs of visitor frustration. Advanced plans add friction insights to help prioritize problems.
- Form analytics: Analyze form interactions, abandonment, and submission failures. This feature is available on Premium and Enterprise plans.
- Conversion funnels: Track visitor progress through important steps, such as signup and checkout. Find where visitors drop off and watch recordings from those steps.
- Feedback surveys: Collect visitor feedback to understand why people struggle with specific pages or interactions. Available from the Advanced plan.
Mouseflow Pricing
Mouseflow offers a free plan with 500 monthly sessions. Paid plans increase session limits and unlock additional analytics features. It also provides a 14-day free trial with access to its core features, without requiring a credit card.
*Prices shown in USD and billed annually. Monthly billing may cost more. Form analytics is available on Premium and Enterprise. Source: Mouseflow official pricing. Pricing checked November 2026.
Pros and Cons of Mouseflow
Should You Choose Mouseflow?
Mouseflow is a good choice if you want to identify usability problems and understand why visitors abandon important website interactions. Its combination of friction detection, session recordings, and form analytics makes it particularly useful for CRO specialists, UX teams, and businesses with lead-generation forms.
Check the session limits and plan requirements before subscribing, especially if you need advanced form analytics.
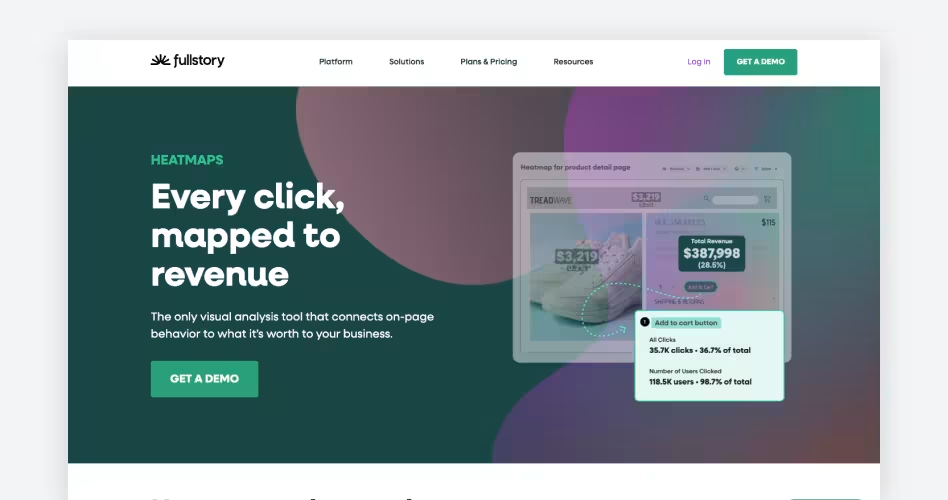
5. FullStory: Product Analytics and Session Replay
Best for: Understanding user behavior and debugging SaaS products
FullStory is a digital experience analytics platform that helps businesses understand how users interact with websites and applications. It combines session replay, heatmaps, product analytics, and frustration signals to reveal where users encounter problems.
Its main strength is connecting individual user interactions with product usage patterns, making it particularly useful for SaaS product managers, UX teams, and developers.
Key Features of FullStory
- Heatmaps: Create click and scroll maps to see which page elements attract interactions and how far users scroll. You can explore aggregated engagement data and compare behavior across user segments.
- Session replay: Replay individual user sessions to investigate navigation patterns, unexpected interactions, and technical problems. FullStory also provides session summaries to help teams review recordings faster.
- Frustration signals: Detect rage clicks, dead clicks, error clicks, and other signs of user frustration. Use these signals to find interactions that aren't working as expected.
- Product analytics: Analyze user behavior through funnels, journeys, metrics, and retention reports. These insights help product teams understand feature adoption and identify where users drop off.
- Developer tools: Investigate JavaScript errors, network problems, and other technical issues within session replays. This helps developers connect user-facing problems with potential technical causes.
FullStory Pricing
FullStory offers a permanent free plan called FullstoryFree. It includes 30,000 monthly sessions and one year of session replay and product analytics retention. Paid plans offer higher session limits and more advanced analytics, but their prices require a sales inquiry.
The free plan includes up to 10 users, 5,000 server-side events monthly, and 12 months of data retention. Paid-plan session allowances and pricing depend on the agreement. Source: FullStory official plans and FullstoryFree plan details.
Pros and Cons of FullStory
Should You Choose FullStory?
FullStory is a strong choice for SaaS companies and product teams that need to understand user behavior beyond basic heatmaps.
Its session replay, frustration detection, and product analytics help teams investigate usability problems and improve feature adoption. However, if you only need click and scroll heatmaps, a simpler and more affordable tool may be enough.
6. Lucky Orange: E-commerce Heatmaps and Conversion Optimization
Best for: Understanding shopping behavior and reducing cart abandonment
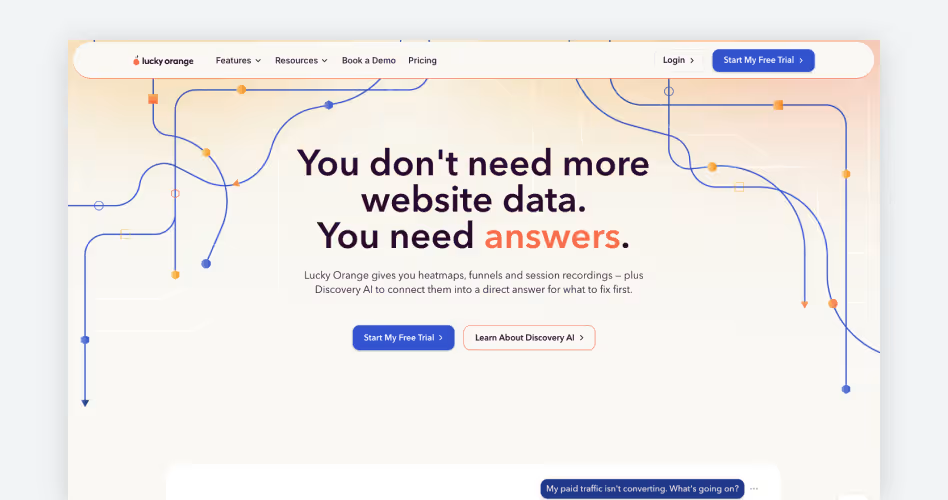
Lucky Orange is a website behavior analytics platform that helps businesses understand how visitors interact with their websites. It combines dynamic heatmaps, session recordings, conversion funnels, form analytics, surveys, and live chat.
Its biggest differentiator is dynamic heatmaps, which capture interactions with elements such as dropdown menus, pop-ups, and expandable navigation. This makes it particularly useful for e-commerce stores and interactive websites.
Key Features of Lucky Orange
- Dynamic heatmaps: Track clicks, taps, scrolling, and cursor movements across website pages. Unlike static heatmaps, they capture interactions with dropdown menus, pop-ups, expandable elements, and single-page applications.
- Session recordings: Replay individual visitor sessions to understand how people navigate your website, interact with products, and encounter problems. Use filters to find sessions with specific behaviors.
- Conversion funnels: Track important visitor journeys, such as product views, add-to-cart actions, and purchases. Identify where shoppers leave before completing an order.
- Form analytics: Analyze how visitors interact with forms and identify fields that cause hesitation or abandonment.
- Live visitor view and chat: See who is browsing your website in real time and communicate with visitors through live chat. You can also use targeted chat invitations.
- Surveys and announcements: Collect visitor feedback and display targeted messages to specific audience segments.
Lucky Orange Pricing
Lucky Orange offers a 7-day free trial with access to all features. Unlike some competitors, its paid plans also include the same core features. The main difference between plans is the number of monthly sessions you can track.
Prices shown as monthly equivalents with annual billing. Monthly billing costs more. All plans include dynamic heatmaps, session recordings, surveys, live chat, conversion funnels, and form analytics.
Discovery AI is an add-on, and longer data retention is available at an additional cost. Source: Lucky Orange official pricing page. Checked November 2026.
Pros and Cons of Lucky Orange
Should You Choose Lucky Orange?
Lucky Orange is a good choice for e-commerce businesses that want to understand how shoppers interact with product pages, menus, forms, and checkout journeys.
Its dynamic heatmaps and conversion funnels help identify where visitors lose interest or abandon purchases. According to Baymard Institute, the average cart abandonment rate is 70.22% across 50 studies, so even small checkout fixes can matter. However, compare its session limits with your website traffic before choosing a plan.
7. Zoho PageSense: Website Optimization and Personalization
Best for: Combining heatmaps, A/B testing, and website personalization
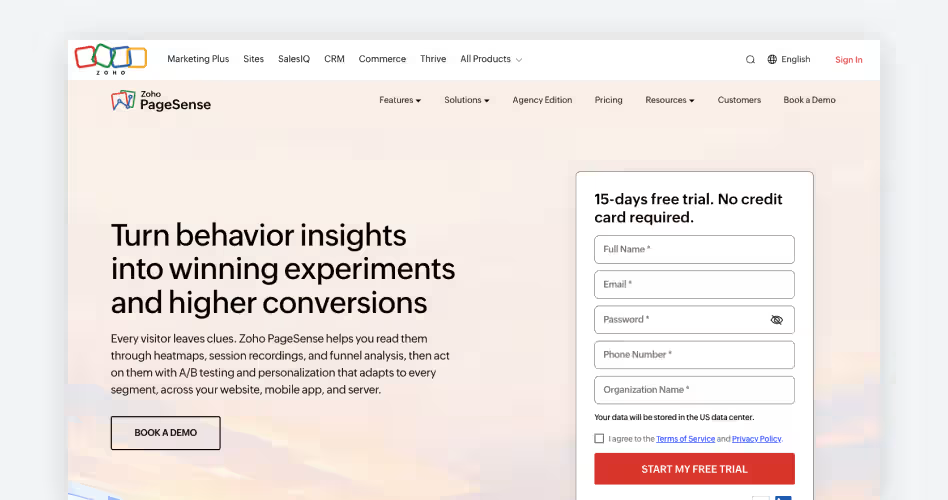
Zoho PageSense is a conversion optimization platform that helps businesses understand visitor behavior and improve website performance. It brings heatmaps, session recordings, form analytics, A/B testing, and personalization together.
Unlike tools focused mainly on behavioral tracking, PageSense also lets you act on those insights through experiments, targeted messages, and personalized website experiences.
What Makes Zoho PageSense Useful?
- Heatmaps with flexible page targeting: Track clicks, scrolling, and visitor engagement across selected pages. PageSense supports URL rules and page groups, making it easier to analyze specific landing pages or groups of product pages.
- Form analytics: Examine individual form fields to find where visitors hesitate, spend too much time, or abandon submissions. This is useful for improving lead-generation and checkout forms.
- Session recordings: Replay visitor interactions to investigate navigation problems and understand what happens before visitors leave a page.
- Website personalization: Show different content and experiences based on visitor attributes, traffic sources, and behavior. For example, you can tailor landing pages to visitors arriving from specific campaigns.
- A/B and split URL testing: Compare different page designs, layouts, and content to identify which version performs better. These testing features are available in the Enterprise plan.
- Visitor engagement tools: Use polls, push notifications, pop-ups, and banners to engage visitors and encourage specific actions. These features are included in the Professional and Enterprise plans.
Zoho PageSense Pricing
PageSense has a permanent free plan, making it accessible to small websites and teams starting with conversion optimization. Paid plans are priced according to monthly tracked users.
Prices are starting rates in USD, billed monthly. Annual subscriptions offer savings of up to 40%. Higher visitor limits cost more. Source: Zoho PageSense official pricing and Pricing plan details. Checked November 2026.
Plan differences worth knowing:
- Forever Free: Includes heatmaps, session recordings, funnel analysis, and form analytics. Data retention is one month.
- Professional: Adds polls, push notifications, pop-ups, and banners. Includes six months of data retention.
- Enterprise: Adds A/B testing, split URL testing, full-stack testing, and personalization. Includes 12 months of data retention.
Pros and Cons of Zoho PageSense
Should You Choose Zoho PageSense?
Choose Zoho PageSense if you want more than heatmaps and session recordings. Its combination of form analytics, visitor engagement, and personalization makes it useful for marketing teams and businesses focused on conversion optimization.
The permanent free plan is also a good starting point. However, if you need A/B testing, you'll need the Enterprise plan.
8. Inspectlet: Session Replay and Website Interaction Analysis
Best for: Combining session recordings, heatmaps, and website testing
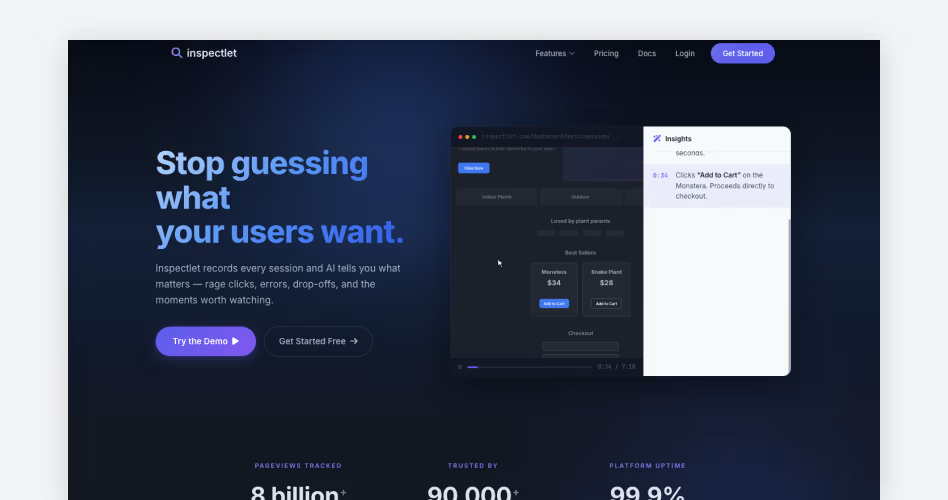
Inspectlet helps businesses understand exactly how visitors interact with their websites. It records user sessions and combines them with heatmaps, form analytics, A/B testing, and error tracking.
One notable advantage is that Inspectlet includes session replay, heatmaps, and A/B testing even on its free plan. Paid plans mainly increase recording limits, website capacity, and data retention.
Key Features of Inspectlet
- Session replay: Watch individual visitor sessions, including clicks, scrolling, mouse movements, and navigation. Filter recordings by traffic source, device, pages visited, and conversion activity.
- Dynamic heatmaps: Generate click, scroll, and eye-tracking heatmaps to understand visitor interactions and predicted visual attention. Inspectlet also supports dynamic content and JavaScript-heavy websites.
- AI Session Insights: Automatically analyze recordings to highlight rage clicks, JavaScript errors, form abandonment, and unusual navigation. This helps teams find important sessions without watching every recording.
- Form analytics: Identify which fields visitors ignore, where they hesitate, and where they abandon forms. Use these reports to improve signup and lead-generation experiences.
- A/B testing: Compare different page designs and measure their performance. Inspectlet includes a visual editor and conversion goal tracking.
- Error logging: Capture JavaScript errors and connect them with session recordings. Developers can investigate technical problems using the context of the affected visitor session.
Inspectlet Pricing
Inspectlet offers a permanent free plan with heatmaps, session replay, and A/B testing. Paid plans increase the number of recorded sessions and data retention.
Unlike tools that hide advanced features behind expensive tiers, Inspectlet includes many core features across its plans, although some capabilities have plan restrictions.
Prices are listed in USD per month. Annual billing offers a 15% discount. Session volume and recording quotas are separate limits. Higher Enterprise plans are available. Source: Inspectlet official pricing. Checked November 2026.
Pros and Cons of Inspectlet
Should You Choose Inspectlet?
Inspectlet is worth considering if you want session replay, heatmaps, and website testing in one platform. Its dynamic heatmaps and form analytics help UX teams investigate interaction problems, while error logging gives developers more context.
The free plan is a useful starting point, but compare its recording allowance with your monthly traffic before relying on it for ongoing analysis.
9. Plerdy: UX Analytics and SEO Optimization
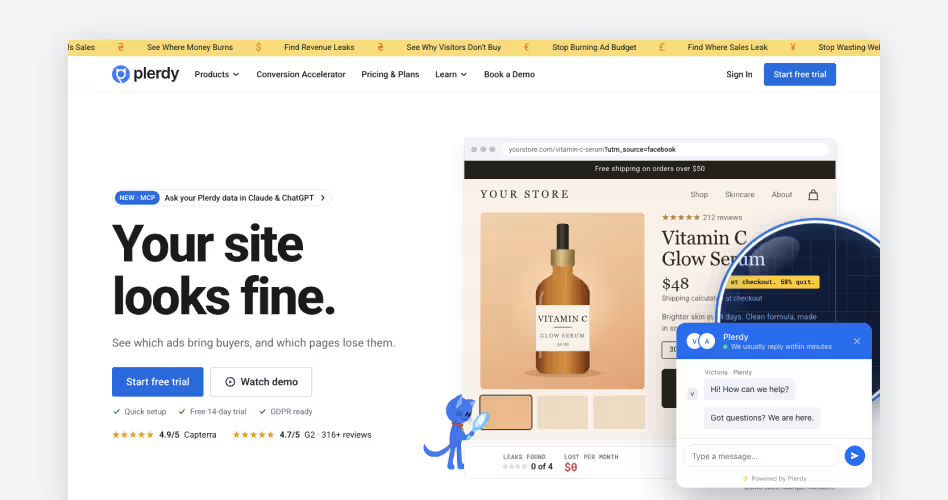
Best for: Combining website behavior analysis with SEO insights
Plerdy is an all-in-one conversion rate optimization (CRO) and SEO platform. It helps businesses analyze visitor interactions, identify website problems, and find opportunities to improve conversions.
Alongside heatmaps and session recordings, it offers SEO audits, e-commerce analytics, pop-ups, and A/B testing. This combination makes it particularly useful for digital marketers, SEO specialists, and online store owners.
Key Features of Plerdy
- Click, scroll, and mouse movement heatmaps: See where visitors click, how far they scroll, and where they move their cursors. Reports also include click sequences and filters for traffic channels, visitor groups, and countries.
- Session replay: Watch recorded visits to understand how users navigate pages, interact with elements, and encounter problems. The timeline highlights clicks, scrolling, form interactions, rage clicks, and errors.
- SEO audit: Analyze page titles, descriptions, keywords, and other SEO elements. Plerdy also integrates with Google Search Console to help identify missed keyword opportunities.
- E-commerce analytics: Track purchases, revenue, and the performance of individual page elements. This helps store owners understand which interactions contribute to sales.
- A/B testing: Compare different page versions to evaluate changes and identify which variation performs better. Plerdy offers this as a separate tool within its platform.
- Pop-ups and website feedback: Create targeted pop-ups and collect visitor feedback through surveys. Use these tools to capture leads and understand why visitors leave without converting.
Plerdy Pricing
Plerdy offers a permanent free plan with limited daily tracking allowances. Paid plans increase heatmap page views, session recordings, SEO audit capacity, and data retention. Annual subscriptions receive a 35% discount compared with monthly billing.
*Prices shown as monthly equivalents with annual billing. The 14-day free trial provides Scale-plan limits. Higher Enterprise plans are also available. Limits differ by feature, so check the official pricing page before subscribing. Source: Plerdy official pricing. Checked November 2026.
Pros and Cons of Plerdy
Should You Choose Plerdy?
Plerdy is worth considering if you manage SEO, UX, and conversion optimization together. Its combination of heatmaps, session replays, SEO audits, and e-commerce analytics reduces the need for several separate tools.
It's especially useful for agencies, digital marketers, and online store owners. However, check its daily tracking limits carefully if your website receives substantial traffic.
10. Heatmap: Revenue-Based Heatmaps and E-commerce Optimization
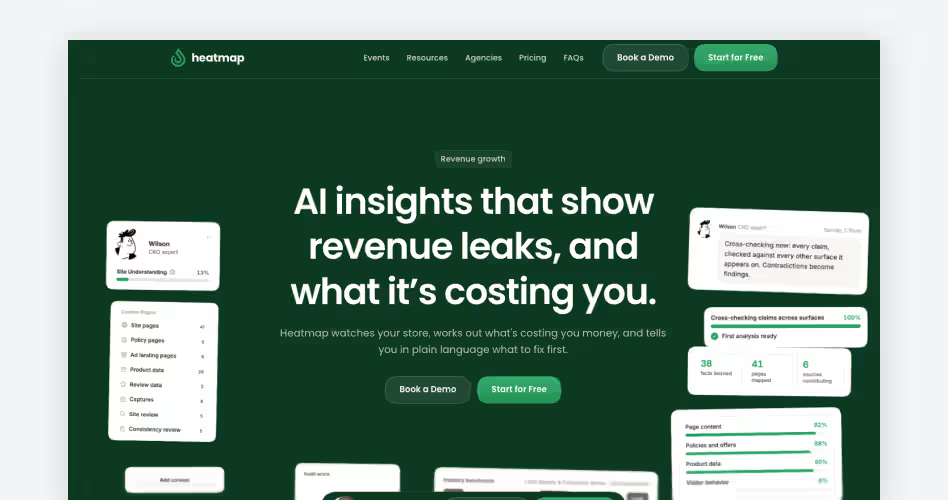
Best for: Tracking how website interactions contribute to e-commerce revenue
Website: heatmap.com
Heatmap is an e-commerce analytics and conversion optimization platform that connects visitor behavior with revenue data. Instead of showing only where visitors click or scroll, it helps businesses understand how individual page elements contribute to purchases and revenue.
It combines revenue-based heatmaps, session recordings, customer journey analysis, funnels, and AI-powered recommendations to help online stores find and fix conversion problems.
What Makes Heatmap Different?
- Revenue-based heatmaps: See how much revenue individual buttons, images, product cards, and other page elements generate. Compare clicks, purchases, conversion rates, and revenue per element to identify which parts of a page contribute to sales.
- Revenue scrollmaps: Understand how far visitors scroll and how much revenue is associated with different page sections. Identify valuable content that visitors might never reach.
- Customer journey analysis: Follow visitors from their first landing page to checkout. Compare the paths taken by customers who purchase with those who leave without buying.
- Revenue-tracked session recordings: Replay visitor sessions with revenue and purchase information. Filter recordings by customer behavior, traffic source, and purchase activity to focus on valuable interactions.
- Funnels and surveys: Identify where shoppers abandon the purchase process. Use on-site surveys to collect feedback and understand why visitors leave.
- AI-powered recommendations: Get suggestions for improving page layouts, content, and website performance. Its AI tools can also analyze store data and help prioritize optimization opportunities.
Heatmap Pricing
Heatmap offers a 14-day free trial rather than a permanent free plan. Its pricing depends on your store's annual revenue, with higher revenue tiers carrying higher subscription costs.
The listed plans include a 14-day free trial. Annual prepayment offers savings of up to 32%. All three plans include heatmaps, scrollmaps, funnels, recordings, surveys, and revenue attribution. MCP/API access is available on Scale. Source: Heatmap official pricing page. Checked November 2026.
Pros and Cons of Heatmap
Should You Choose Heatmap?
Heatmap is worth considering if you run an e-commerce store and want to understand which website elements generate revenue. Its revenue-based heatmaps, purchase journeys, and AI recommendations help connect user behavior with business results.
However, its pricing and e-commerce focus make it less suitable for blogs, portfolios, and websites that only need basic click and scroll tracking.
Free Heatmap Tools: What Each Free Plan Includes
Many teams want a website heatmap free of charge, and several tools on this list have permanent free plans. Here are the heatmap tools free to use from this list, along with the limits on each free heatmap software plan. Check those limits before you install one.
- Microsoft Clarity: The free Microsoft website heatmap tool gives you unlimited heatmaps, websites, and team members with no traffic limits. It's the best free heatmap software if you do not want any caps.
- Contentsquare: The free plan covers up to 200,000 monthly sessions, though session replay capture is sampled.
- FullStory: FullstoryFree includes 30,000 monthly sessions and 12 months of data retention.
- Inspectlet: The free plan includes heatmaps, session replay, and A/B testing, with up to 5,000 session replays a month.
- Zoho PageSense: The Forever Free plan covers 5,000 monthly tracked users, with heatmaps, session recordings, funnel analysis, and form analytics.
- Mouseflow: The free plan allows 500 monthly sessions on one website.
- Plerdy: The free plan allows 100 heatmap page views per day.
If you prefer open source heatmap software, you can self-host a platform like PostHog or Matomo. PostHog is open source and includes heatmaps.
Matomo is open source too, but its heatmaps and session recordings are paid add-ons in the self-hosted version. A website heatmap open source setup gives you full control over your data, but you'll need to manage hosting and updates yourself.
Best Hotjar Alternatives
Hotjar is one of the best-known heatmap tools. It has a free Basic plan limited to 35 daily sessions, and its paid plans scale with daily sessions. If you've outgrown it, these are the best Hotjar alternatives from this list.
- Free Hotjar alternatives: Microsoft Clarity has no traffic limits, and Zoho PageSense, Inspectlet, and FullStory also have free plans.
- A/B testing: Crazy Egg, Inspectlet, and Zoho PageSense include A/B testing, although plan limits differ.
- Online stores: Lucky Orange and Heatmap focus on shopping behavior and revenue.
- Forms and friction: Mouseflow is strong at form analytics and friction detection.
- SaaS and enterprise teams: FullStory suits product teams, and Contentsquare suits larger enterprise teams.
- Mobile apps: Looking for Hotjar alternatives for mobile apps? Microsoft Clarity offers SDKs for Android and iOS, and Contentsquare and FullStory also cover apps.
What Are the Different Types of Heatmaps?
Heatmap analytics covers several types of visitor interactions. Each type helps you understand a specific aspect of user behavior, from clicks and scrolling to areas that attract attention.
In any website heatmap example, warm colors such as red and orange show the most activity, while cool colors such as blue and green show the least.
1. Click Heatmaps
read one, look at the color intensity around buttons, links, images, and other page elements. Areas with more clicks appear more prominent than those with fewer interactions.
Use this data to identify ignored CTAs, popular navigation links, and elements visitors expect to be clickable.
2. Scroll Heatmaps
Scroll heatmaps, also called scroll maps, show how far visitors move down your webpage. They use color variations to represent the percentage of visitors who reach different sections. Areas with fewer visitors indicate where scrolling activity drops.
Use this data to check whether visitors reach important content, where they stop scrolling, and whether your CTAs need better placement. Start with your hero section, since it's the first thing visitors see. Our SaaS hero section design guide shows how to get it right.
3. Mouse Movement Heatmaps
Mouse movement heatmaps, also called move maps, show how visitors move their cursors across a webpage. Open a heatmap report to see where visitors move their pointers, pause, or hover over elements. Areas with more cursor activity appear more prominent, helping you identify sections that attract interaction.
Use these patterns to evaluate how visitors explore your page. For example, if visitors repeatedly hover around a navigation menu or an image, you can investigate whether those elements need clearer labels or better interaction cues. Keep in mind that cursor movement doesn't always reflect where someone is looking.
4. Attention Heatmaps
Attention heatmaps show which parts of a webpage are likely to attract the most visual attention. Depending on the tool, you can generate these reports using actual eye-tracking studies or AI-powered predictive models. The resulting visualization highlights areas that receive or are predicted to receive more attention.
Use these reports to evaluate your page's visual hierarchy. Check whether visitors are likely to notice your headlines, product images, and primary CTAs. If important elements receive little attention, consider adjusting their placement, size, or visual contrast.
5. Rage Click Heatmaps
Rage click heatmaps help you find areas where visitors repeatedly click without getting the expected response. Open the report to identify clusters of rapid, repeated clicks around buttons, links, images, or other interface elements.
Once you find a hotspot, review the associated session recording to understand what happened. Check whether the element is broken, takes too long to respond, or looks clickable when it isn't.
Fixing these issues can reduce interaction friction and improve the browsing experience. Dead clicks, which get no response at all, are worth checking the same way. To see how these problems look in real products, browse these bad UX examples.
How to Read and Analyze a Website Heatmap
Reading a website heatmap is simple once you know what the colors mean. Warm colors show more activity, and cool colors show less. For solid website heatmap analysis, follow these steps:
- Start with one goal: Pick a page and one question, such as whether visitors see the main CTA.
- Use the right map: Check a click map for buttons and links, a scroll map for content depth, and a move map for hover patterns.
- Compare devices: Desktop and mobile visitors often behave differently, so review them separately.
- Watch session replays: Open a few recordings from each hotspot to see what visitors were trying to do.
- Check your other data: Compare what you see with GA4 or funnel data, and wait until you have enough sessions before changing the page. Pair heatmaps with usability testing too, because heatmaps show what users do, not why.
If you would rather have experts turn these findings into fixes, a UX design agency can run the audit and redesign for you. A full audit with user testing, heatmap analysis, and a prioritized report costs about $8,000 to $20,000, according to our UI/UX design cost guide.
How to Choose the Right Heatmap Tool
Choosing a website heatmap tool involves more than comparing features. You need to find website heatmap software that works with your website, captures the interactions you want to analyze, and fits your budget. Follow these steps to narrow down your options.
1. Identify What You Want to Analyze
Start by identifying the problems you want to investigate. For example, you might want to understand why visitors ignore your CTAs, abandon forms, or leave landing pages without converting.
Make a list of the interactions you want to track. This will help you decide which heatmap features you actually need.
2. Compare Heatmap and Session Recording Features
Check which heatmap types each tool supports. Most platforms offer click and scroll heatmaps, while some also include mouse movement, attention, and rage click analysis.
Look for built-in session recording software, too. Good user session recording software lets you replay individual visits and understand what happened before a visitor clicked, abandoned a form, or left a page.
3. Check Website Compatibility
Before choosing a website heatmap tool, make sure it works with your website platform and technology stack.
Check whether it supports:
- CMS platforms like WordPress, where a website heatmap WordPress plugin or a simple tracking code usually does the job.
- E-commerce platforms like Shopify.
- JavaScript frameworks like React and Vue.
- Single-page applications (SPAs) and dynamic page elements.
- Mobile apps on iOS and Android, if you want to track app screens as well as websites.
Also, check whether it integrates with tools like Google Analytics 4 and Google Tag Manager.
4. Review Pricing and Tracking Limits
Compare pricing based on your monthly website traffic, not just the advertised starting price.
Check these details before subscribing:
- Monthly session or recording limits.
- Traffic sampling and data collection restrictions.
- Session recording retention periods.
- Feature availability across pricing plans.
- Additional charges when traffic increases.
A free plan might work for a small website, but growing businesses may need higher recording limits and more advanced features.
5. Check Privacy and Data Security
Heatmap tools collect visitor interaction data, so review how each platform handles sensitive information.
Check whether the tool offers:
- Automatic masking for passwords and payment fields.
- GDPR and CCPA compliance support.
- Cookie consent and tracking controls.
- Data retention and deletion settings.
- Regional data hosting options, if required.
If your website handles sensitive customer information, make privacy requirements part of your selection process.
6. Test Website Performance Before Committing
Finally, test the tracking script on your website before deploying it everywhere.
Check whether it affects page loading, JavaScript execution, or Core Web Vitals. Test important pages on both desktop and mobile, and compare performance before and after installation.
Google research from 2017 found that as mobile page load time goes from one second to seven seconds, the chance of a visitor bouncing rises 113%, so a slow tracking script can cost you visitors.
If the tool creates noticeable performance issues, contact the provider or test another solution before committing.
Frequently Asked Questions
What is a heatmap tool?
A heatmap tool is software that tracks where visitors click, scroll, and move on a page and shows the results as a color-coded map. Most heatmap tools also include session recordings, so you can investigate what happened during individual visits.
Which heatmap tool is best?
There is no single best heatmap tool, because the right choice depends on your goal and budget. Microsoft Clarity is the best starting point for most websites because it's free with no traffic limits. Choose Crazy Egg or Zoho PageSense if you want A/B testing, Lucky Orange or Heatmap for online stores, and Contentsquare or FullStory for larger teams and SaaS products.
Is there a free heatmap tool?
Yes. Microsoft Clarity is the best completely free heatmap tool. It provides unlimited session recordings, click tracking, and scroll maps with no monthly traffic caps or paywalls. Other free heatmap software, such as Zoho PageSense, Inspectlet, and FullStory, has free plans with usage limits. Microsoft monetizes Clarity through aggregated, anonymized search analytics data rather than charging subscription fees.
Does Google Analytics have heatmaps?
No. Google Analytics 4 does not have built-in heatmaps. It tracks traffic, events, and conversions, but it cannot show a click map or scroll map. To see a website heatmap next to your GA4 data, pair it with a heatmap tool such as Microsoft Clarity, which integrates with Google Analytics.
Is Microsoft Clarity better than Hotjar?
It depends on what you need. Microsoft Clarity is completely free with unlimited traffic recordings and built-in AI behavior summaries, so it is better if you want a free heatmap tool without session limits. Hotjar has a free Basic plan with a small daily session limit, and its paid plans are based on session volume. It also offers qualitative research tools that Clarity lacks, such as on-site feedback widgets, user surveys, and user interview recruiting. A Hotjar website heatmap works well for teams that want heatmaps and feedback in one place.
How do you read a website heatmap?
Look at the colors first. Warm colors like red and orange show the most clicks, scrolls, or attention, and cool colors like blue and green show the least. Start with one page and one goal, check the right map type, and then watch a few session recordings to understand why visitors behaved that way.
What is the difference between a click map and a scroll map?
Click maps display aggregated user taps and mouse clicks to identify high-interest buttons, broken links, or dead clicks. Scroll maps show the exact percentage of visitors who scroll down to specific page depths, helping you place critical conversion elements above drop-off points.
How many sessions do you need for a reliable heatmap?
For a reliable heatmap, you need at least 2,000 to 3,000 page views per page template to establish statistical significance. Reviewing heatmaps with fewer visits often leads to misleading conclusions, because individual random clicks skew visual color concentrations before clear user behavior patterns emerge.
Do heatmap tools slow down a website?
Most heatmap tools load asynchronously without blocking initial page rendering. However, scripts recording continuous DOM mutations can increase JavaScript execution time and harm Interaction to Next Paint scores. Using lightweight tracking scripts under 40 kilobytes minimizes CPU overhead on mobile devices.
Are heatmap tools GDPR compliant?
Most leading heatmap platforms comply with GDPR and CCPA when configured properly. Compliance requires obtaining cookie consent before firing tracking scripts, storing European data on EU servers, suppressing IP addresses, and providing users an opt-out mechanism for session recordings.
Can you use heatmaps on mobile apps?
Yes, but only with tools that support mobile apps. Microsoft Clarity offers a lightweight SDK for Android and iOS that captures tap heatmaps and session replays inside your app. Contentsquare and FullStory also support app analytics. Many other heatmap tools focus on websites only, so check mobile app support before you choose.
Can heatmap tools track user interactions on dynamic single-page applications?
Yes, modern heatmap tools track dynamic single-page applications built on React, Vue, or Angular. They capture client-side virtual page views, DOM state updates, and interactive elements like accordion menus or modal pop-ups without requiring a full browser page refresh.
Can heatmap tools record sensitive user passwords and credit card details?
Reputable heatmap tools automatically mask passwords, payment details, and personal identity numbers on the client side before data leaves the browser. Website owners can also apply custom CSS masking classes to obscure proprietary customer data and form input fields from session replays.
Final Thoughts
The best heatmap tools help you understand how visitors interact with your pages. Use click, scroll, and attention data to identify ignored CTAs, confusing layouts, and usability issues that traditional analytics might not reveal. These insights help you make better design decisions based on actual visitor behavior rather than assumptions.
Before choosing a tool, compare its heatmap features, session recording capabilities, pricing, and traffic limits. Start by analyzing your most important pages, identify where visitors struggle, and make targeted improvements. Combine heatmap insights with analytics and user feedback to create a smoother website experience. If you are just starting out, a free heatmap tool like Microsoft Clarity is an easy way to begin.