Table of Contents
- What SaaS Founders Get Wrong About UX Redesign
- Where Your SaaS is Actually Losing Users
- The 6-Step SaaS UX Redesign Process
- SaaS Conversion Benchmarks: What Good Actually Looks Like
- Redesign Tactics That Directly Lift Trial-to-Paid Rates
- How Orbix Studio Approaches SaaS UX Redesign
- Red Flags to Watch Before Starting a Redesign
- Frequently Asked Questions
- Conclusion



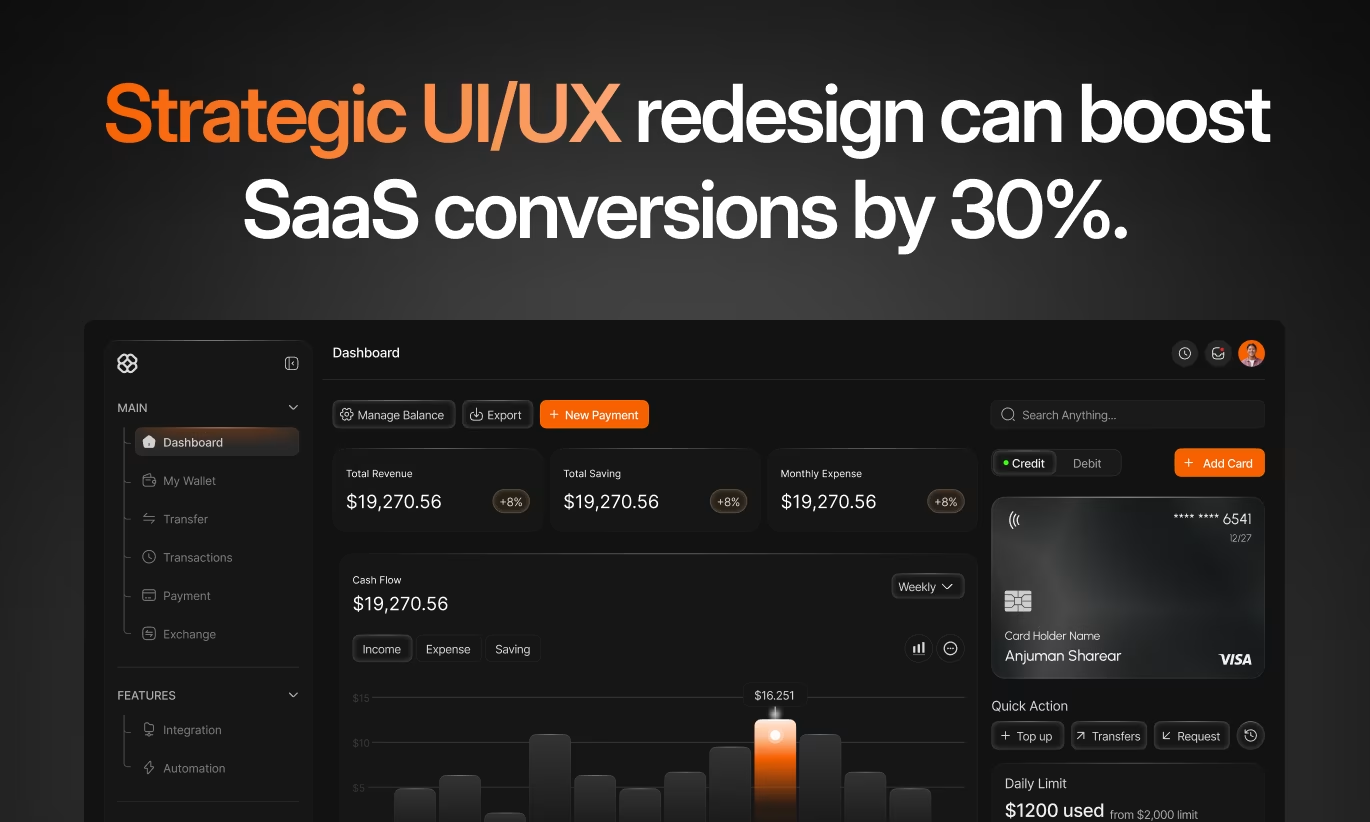
- A SaaS UX redesign should focus on reducing friction in onboarding, navigation, and user flows so trial users convert into paying customers.
- Prioritize fixing the activation flow first, then improve signup, followed by secondary UX issues.
- Most teams redesign the interface when the real problem is usually the onboarding sequence.

Your SaaS product solves a real problem. Users sign up, poke around, and leave anyway. Trial-to-paid rates stay at 8%, churn creeps up every quarter, and adding features hasn't fixed either number. Founders blame the product. But when we audit SaaS products, the problem almost always sits in the experience not the functionality.
A strategic SaaS UX redesign for conversions doesn't mean making the product prettier. It means identifying exactly where users lose confidence, fail to find value, or hit friction and remove those moments one by one until a user's first session reliably leads to a second, a third, and a payment.
According to McKinsey, design-led companies outperform industry benchmarks by 32% in revenue growth. Every dollar invested in UX redesign returns roughly $100 in business value. But only when the redesign targets the right problems in the right order.
This guide gives you the exact process, the benchmarks to aim for, and the specific tactics that move conversion metrics without guessing.
What SaaS Founders Get Wrong About UX Redesign
SaaS founders treat UX redesign as a visual refresh of new colors, updated components, and a cleaner layout. That produces a product that looks better and converts the same.
A redesign that lifts conversions starts with a question: where are users dropping off, and why? Without that answer, every design decision is a guess. And guesses don't move trial-to-paid rates.
Here's the pattern we see most often. A team ships a redesign that improves the marketing site, cleans up the dashboard, and adds better empty states. Signups tick up 15%. Activation stays flat. Paid conversion barely moves. Why? Because the marketing site wasn't the bottleneck the first session was. Users signed up, hit a 9-step onboarding flow, skipped two required fields, and left before reaching the feature they came for.
The second mistake is redesigning everything at once. Changing navigation, onboarding, and the pricing page in a single sprint makes it impossible to know what moved the number. Two months later, you have a better-looking product and no idea whether it converts better because of the onboarding rewrite or despite the navigation change.
Redesign one flow at a time. Measure each change. Stack the wins.
Now that you know what not to do, here's exactly how to find the real bottleneck in your conversion funnel.
Where Your SaaS is Actually Losing Users
SaaS conversion breaks in four predictable places. Identifying which one applies to your product determines where the redesign starts.
Visitor to signup: Optimized experiences convert 8–12% of visitors. Below 3% means the marketing site, signup form, or value proposition is unclear. Friction at this stage is almost always excessive form fields, weak above-the-fold copy, or a missing trust signal.
Signup to activation: Activation means a user completes a core task and experiences real product value. Industry benchmarks put this at 40–60%. Below 30% means the onboarding flow isn't getting users to the "aha moment" fast enough. According to OpenView Partners, users who activate in their first session convert at 4x the rate of those who don't.
Trial to paid: A healthy opt-in trial converts 15–25% of activated users. Below 10% signals that users aren't seeing enough value during the trial period or the upgrade experience adds friction at the moment of decision.
Paid to retain: Churn above 5% monthly means users aren't embedding the product into their workflow. That's a feature discovery and navigation problem more than a pricing one.
Run your numbers against these benchmarks before doing anything else. One broken stage explains most of your conversion loss. Fix that stage first.
Understanding B2B SaaS conversion patterns is also worth doing before you start B2B and B2C SaaS have fundamentally different user expectations and conversion levers, and the tactics that work for one often fail for the other.
The 6-Step SaaS UX Redesign Process
A SaaS UX redesign for conversions follows six steps in a fixed sequence. Skipping steps or changing their order produces inconsistent results. Each step builds on the one before it.
Step 1: Data-Driven Diagnosis
Start with the data before touching any design. Review your full conversion funnel in Mixpanel or Amplitude map where users drop off at each stage. Layer on Hotjar heatmaps and FullStory session recordings to see the actual paths users take versus the paths you designed.
Three data sources give the clearest picture fastest: funnel analytics showing drop-off percentages, session recordings showing the exact moment users stop engaging, and support ticket patterns showing what users are frustrated enough to write about.
Establish a baseline for every key metric before the redesign starts. Without a baseline, you can't prove the redesign worked and you can't tell which change was responsible.
Step 2: User Research
Numbers show where the problem is. Research shows why it exists. Qualitative research is what separates a redesign that solves the actual problem from one that solves the problem you assumed users had.
Run user interviews with three groups: churned users who left in the first 30 days, active power users who stuck around, and stalled trial users who signed up but never activated. Each group gives you a different angle on the same flow. Usability testing watching real users attempt your signup and onboarding without any guidance reveals friction points that internal teams are completely blind to.
Before you decide on a research method, our breakdown of SaaS product research vs market research covers when each approach gives you the most useful signal.
Step 3: Prioritize the Highest-Impact Redesign Areas
Not every redesign effort moves conversion metrics equally. Rank redesign candidates by two criteria: how many users hit this flow, and how much does friction here cost in revenue.
Onboarding almost always ranks first. Improving activation from 30% to 50% changes unit economics across the entire funnel. Signup flow ranks second because it gates every downstream metric. Core feature workflows rank third because they determine whether users perceive enough value to pay.
Pricing and upgrade flows rank fourth. Redesigning these delivers high ROI because users at this stage have already decided they want the product; friction here is the only thing stopping them from paying for it.
Step 4: Redesign the Critical Flows
Apply four principles to every flow you redesign. Reduce cognitive load by removing anything the user doesn't need to see right now. Use progressive disclosure to show advanced features only after users have demonstrated basic competence. Apply a clear visual hierarchy so the next action is always obvious. Build trust at every decision point with customer logos, security signals, and transparent information.
Specific tactics for each flow are covered in the next section.
Step 5: Test Before Full Launch
No redesign goes live to 100% of users without testing first. A/B test single elements in isolation one change per test so you know what moved the metric. Prototype-test high-stakes flows like onboarding and upgrade experiences with 5–8 real users before development begins. Use staged rollouts to limit exposure to 10–20% of traffic while monitoring conversion metrics and support volume.
Statistical significance matters. A 5% improvement on 200 sessions isn't a signal, it's noise. Wait for meaningful sample sizes before calling a winner.
Step 6: Track and Iterate
Post-launch monitoring runs for 30–90 days minimum. Watch conversion metrics daily for the first two weeks. Watch support ticket volume for new confusion patterns. Watch session recordings for new drop-off points.
Every redesign creates new questions. Users who now complete onboarding may still drop off at a different step. Iteration is the mechanism that compounds gains not the single launch.
SaaS Conversion Benchmarks: What Good Actually Looks Like
Use this table to compare your current metrics against industry benchmarks. Red means redesign priority. Green means the flow is working.
If two or more of your metrics fall in the "below average" column, the redesign priority is always the earliest broken stage. Fixing trial-to-paid before fixing activation is like patching a bucket's middle hole while the bottom is open.
Redesign Tactics That Directly Lift Trial-to-Paid Rates
Five specific redesign areas deliver the most measurable conversion improvements. Each one maps to a different stage of the funnel.
Signup Flow: Remove Every Unnecessary Step
Reduce form fields to the absolute minimum at signup email and password only. Every additional field cuts conversions 5–10%, according to Baymard Institute research on form abandonment. Request company size, role, and use case after users have experienced value, not before.
Social signup options (Google, GitHub, Microsoft) convert 20–40% better than email-only forms in B2B SaaS. Add them as the primary option, not an afterthought below the form. Position one strong trust signal a customer count, recognizable logo, or security badge directly next to the submit button.
Onboarding: Engineer the Aha Moment
Empty state design is the most underrated conversion lever in SaaS. When a user logs in for the first time and sees a blank screen with a generic "Get started" message, 40–60% leave before completing a single action.
Stripe's empty state shows a demo transaction so users immediately see what success looks like. Linear's empty state pre-populates an issue list so users understand the workflow before creating anything.
Identify your product's aha moment, the specific action that correlates most strongly with trial-to-paid conversion. Design onboarding as a single direct path to that action. Remove every step that doesn't contribute to reaching it.
Progress indicators work. Users who see a completion percentage on an onboarding checklist complete it at 2.5x the rate of users who don't, according to Appcues activation data.
Navigation and Feature Discovery
Poor information architecture buries features that users need and never find. Run a navigation audit before redesigning: categorize every item by how often users need it and how far it currently sits from the home screen. Items used daily should require one click. Items used weekly should require two.
Search with autocomplete and result previews helps users find features faster than menu browsing, especially in products with 20+ features. HubSpot's command palette lets power users access any feature by typing two or three characters that pattern works in any SaaS product with complex workflows.
For a deep look at how to structure dashboard navigation specifically, our complete guide to SaaS dashboard design covers information architecture, hierarchy, and the most common structural mistakes by product type.
Pricing and Upgrade Experience
Visual comparison tables reduce cognitive load at the upgrade decision. Show exactly three plan options, not two, not five. Highlight the recommended plan with a visual cue, not just a label. Explain plan differences in outcome language ("analyze 50 competitors" not "50 competitor credits").
Remove every step between the upgrade decision and feature access. Intercom's upgrade flow takes 3 clicks from decision to active subscription. Framer's upgrade experience gives immediate access and sends confirmation asynchronously users start using premium features before the email arrives.
Annual billing discounts of 15–25% consistently move users toward annual plans when positioned as a default. Showing the monthly savings in concrete dollar amounts ("save $480/year") outperforms percentage framing in B2B SaaS pricing tests.
Mobile-First Responsive Design
Between 40–60% of B2B SaaS traffic now comes from mobile devices. Touch targets below 44x44 pixels, navigation menus requiring precise taps, and forms that don't trigger the right keyboard type all cut mobile conversion rates optimization significantly.
Sticky CTAs for primary actions perform better than static button placement on mobile. One SaaS company increased mobile trial starts by 18% simply by adding a persistent sticky CTA that stayed visible while users scrolled a change that took one afternoon to implement.
Now that you know the specific tactics that work, here's how Orbix Studio structures these changes into a redesign engagement that delivers measurable outcomes.
How Orbix Studio Approaches SaaS UX Redesign
Orbix Studio's SaaS UX redesign process starts with a 2-hour audit call, not a proposal deck. Before any design work begins, we map your current funnel metrics against the benchmarks above, identify the single highest-leverage stage to fix first, and align on the measurable outcome the engagement will target.
Research runs in week one. For most SaaS products, that means reviewing 20–30 session recordings, running 6 user interviews across the three user segments above, and auditing the current information architecture against actual usage patterns.
Design and testing run in parallel from week three onward. Every flow gets prototype-tested with real users before development. Staged rollouts go to 10–20% of users first, with a 14-day monitoring window before full release. Every engagement includes a post-launch metrics review at 30 and 60 days.
For SaaS products with existing design debt navigation that's been patched instead of rebuilt, or dashboard structures that have grown without an IA audit our SaaS UI/UX design service covers end-to-end redesign with design system handoff.
Want to see how Orbix approaches your specific conversion bottleneck? See our SaaS design process →
Red Flags to Watch Before Starting a Redesign
Knowing when not to redesign saves more money than knowing how. A redesign is the wrong investment if you don't have at least 200 monthly active users generating consistent behavioral data with fewer users, you're redesigning based on opinions, not patterns.
Ask these five questions before committing to a full redesign:
1. Do you know your current activation rate? If you can't answer this within 5 percentage points, you don't have enough measurement in place for a redesign to produce interpretable results. Add tracking first.
2. Have you read at least 30 session recordings? Real user behavior frequently contradicts what the team assumes. Session recordings are the fastest way to find friction that analytics don't surface.
3. What's the one metric you're trying to move? A redesign targeting "better UX" has no success criteria. A redesign targeting "increase trial-to-paid from 9% to 18% within 90 days" does.
4. Do you have the development capacity to implement changes within 4 weeks of design? Designs that sit in a backlog for 3 months get implemented out of context and don't deliver the intended experience.
5. Is there a competing product shipping faster than you? If competitors are shipping new features weekly, a 3-month redesign project may cost more in competitive ground than it gains in conversion lift. A focused 4-week sprint on the activation flow often delivers better ROI.
UX improvements that reduce friction also directly lower churn but churn has its own set of design patterns that work differently from conversion redesign. For the specific UX strategies that keep users engaged after activation, our guide to reducing customer churn through UX design covers the retention-focused patterns in full.
If you're also evaluating the full cost of a redesign engagement before committing, our website redesign cost breakdown gives you specific ranges by scope, timeline, and team type.
Frequently Asked Questions
What is SaaS UX redesign for conversions?
SaaS UX redesign for conversions means restructuring user flows, onboarding sequences, and navigation to remove friction that stops trial users from becoming paying customers. It's different from a visual refresh; every change targets a specific metric: activation rate, trial-to-paid conversion, or monthly churn.
How long does a SaaS UX redesign take?
A focused sprint targeting one flow (signup or onboarding) takes 4–8 weeks from research to launch. A full product redesign covering navigation, onboarding, feature workflows, and pricing typically runs 12–20 weeks. Timeline depends on scope, not complexity fixing one stage first and shipping delivers faster ROI than waiting for a complete redesign.
What is a good trial-to-paid conversion rate for SaaS?
A strong opt-in trial converts 20–35% of activated users to paid. Below 10% signals a problem in the trial experience itself: users aren't reaching the feature that makes them want to pay. Between 10–18% is average. Above 25% usually means the onboarding sequence reliably gets users to a clear value moment before the trial ends.
Why do SaaS users sign up but never activate?
Users sign up but never activate because the first session doesn't get them to a value moment fast enough. Common causes include a blank empty state with no guidance, a multi-step onboarding flow that asks for setup information before showing any product value, or unclear next actions after login. Most products fix this by redesigning the first 5 minutes of the user experience.
What should I redesign first, the marketing site or the product?
Redesign the product's activation flow first, unless your visitor-to-signup rate is below 3%. Marketing site improvements bring more users into a broken product experience and they don't fix the conversion gap. Once activation reaches 40%+, marketing site optimization delivers meaningful returns because the product can convert the traffic it receives.
How does Orbix Studio approach SaaS UX redesign?
Orbix Studio starts every redesign engagement with a conversion audit mapping current funnel metrics, reviewing session recordings, and running user interviews before any design work begins. Engagements target a single measurable metric, use prototype testing before development, and include a 30-day post-launch review. See our full SaaS design process here.
What does a SaaS UX redesign cost?
A focused activation or onboarding redesign typically runs $10,000–$30,000. A full product redesign covering navigation, core workflows, and design system runs $50,000–$150,000. Enterprise-scale redesigns with multiple user roles and integration workflows start above $200,000. ROI from a well-executed redesign typically justifies the investment within 6–12 months through improved conversion and reduced churn.
Conclusion
SaaS UX redesign for conversions delivers the highest leverage of any growth investment available to a SaaS founder but only when it targets the right stage, uses the right data, and changes one thing at a time.
Find your conversion benchmark gap using the table above. Identify the earliest broken stage. Start there, not with the stage that looks the most broken on the surface.
Before talking to any design partner, run 30 session recordings through FullStory or Hotjar, pull your activation rate from Mixpanel, and write down the one metric you need to move. That 90-minute exercise will make every subsequent conversation with your team or with an agency dramatically more focused.
Ready to see exactly where your SaaS is losing conversions? Book a free strategy call with Orbix Studio →
Ready to boost your SaaS conversions by 30% or more?
.avif)