


- What B2B SaaS Conversion Rate Benchmarks Actually Measure
- SaaS Website Conversion Rate Benchmarks
- Trial-to-Paid SaaS Conversion Rate Benchmarks
- B2B Sales Funnel Conversion Rate Benchmarks by Stage
- Funnel Conversion Rates by Industry: Why Your Category Matters
- What is a Good Funnel Conversion Rate? The Right Way to Answer This
- How to Measure Your B2B SaaS Conversion Rates Without Distorting the Data
- What Actually Improves B2B SaaS Conversion Rates
- Common Mistakes When Reading SaaS Conversion Benchmarks
- B2B SaaS Funnel Conversion Benchmarks: Reference Table
- How Product and UX Design Directly Drive SaaS Conversion Rates
- Frequently Asked Questions
- Conclusion


.svg)

B2B SaaS Conversion Rate Benchmarks 2026: What Each Stage Actually Looks Like
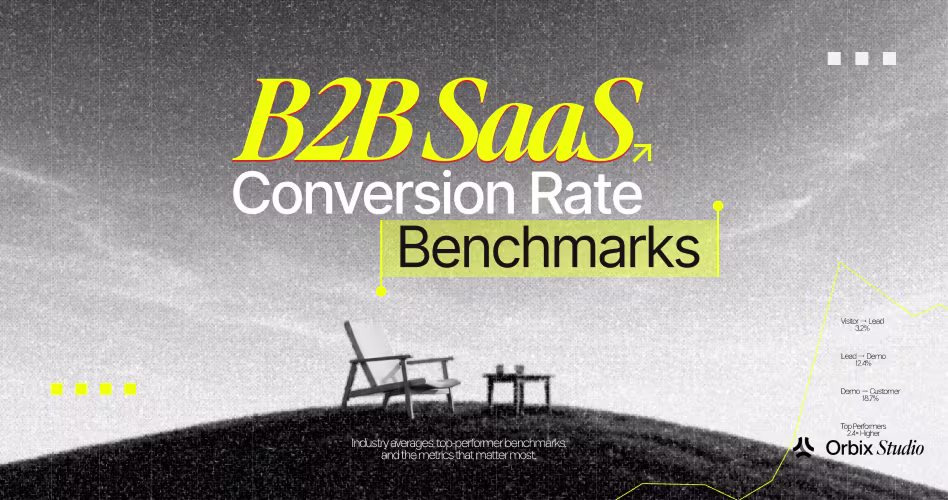
- B2B SaaS conversion rate benchmarks vary sharply by funnel stage, model, and deal size. There is no single "good" number.
- Match the benchmark to your motion: self-serve, sales-assisted, or enterprise. Each runs on completely different ranges.
- The single most common mistake is applying a self-serve benchmark to a sales-led product and concluding the product is broken.
"What is a good conversion rate?" Every SaaS founder asks this eventually. The answer is not a number. It's a question back: good compared to what? A 3% trial-to-paid rate is strong for a self-serve product running with no sales team. That same 3% would signal a serious problem if you have reps touching every trial.
B2B SaaS conversion rate benchmarks only tell you something useful when you compare the right stage, the right model, and the right deal size. A self-serve tool at $29/month does not belong in the same data set as a sales-led platform closing at $30,000 ARR. Treating those as equivalent is how founders spend months fixing the wrong part of the funnel.
This guide breaks down real b2b saas conversion rate benchmarks by funnel stage, business model, industry, and deal size. You'll see where the averages actually sit, which stages bleed the most revenue, what separates a 2% site from a 7% site, and how to measure your own numbers without the distortions that make most SaaS analytics misleading.
What B2B SaaS Conversion Rate Benchmarks Actually Measure
B2B SaaS conversion rate benchmarks track how efficiently your product moves prospects through each stage of the funnel, from first visit to paying customer. No single "conversion rate" exists.
The term covers website-to-trial, trial-to-paid, MQL-to-SQL, SQL-to-opportunity, and opportunity-to-close. Each stage has its own benchmark range, and each one tells a different story about where your funnel is healthy and where it leaks quietly for months before anyone notices.
The first rule of benchmarking: a conversion rate without a stage label is a number without meaning.
When a founder says "our conversion rate is 4%," the only relevant question is: 4% of what, converting to what? Pinning the right benchmark to the right stage is what separates a useful insight from a month of work optimizing the wrong screen.
The Five Funnel Stages That B2B SaaS Actually Runs On
Every B2B SaaS funnel moves through visitor-to-trial (or visitor-to-demo), trial-to-activated user, activated user-to-paid, opportunity-to-close, and expansion. Each stage has its own conversion lever. Measuring only one stage gives you a partial picture and sends optimization effort in the wrong direction.
For a deeper look at how conversion and UX interact across the funnel, see our guide on SaaS UI patterns for conversion.
SaaS Website Conversion Rate Benchmarks
Your SaaS website conversion rate is the percentage of visitors who start a trial or request a demo. This rate sits at the top of everything that follows. The average saas website conversion rate across the industry lands between 2% and 5%.
Top-performing SaaS landing pages regularly clear 7%, while underperforming ones sit below 1%. That gap is not about ad spend. It's about how fast the page answers "why should I care and why should I trust you?"
If your SaaS website converts below 2%, the problem is almost never the offer: it's the page.
According to Unbounce's Conversion Benchmark Report, SaaS landing pages carry a median conversion rate of around 3.8%, with significant variation by traffic source. Organic search converts higher. Paid display converts lower. Blending those two numbers into one site-wide rate hides which channel actually has a problem.
Self-Serve vs. Sales-Led Website Conversion Rates
A self-serve SaaS page asking visitors to "Start free trial" targets a different buyer than a sales-led page routing visitors to a demo form. Self-serve pages on warm traffic typically convert 4–7%.
Sales-led pages booking demos run 1–3%, because the task is bigger and the purchase cycle is longer. Comparing these two directly is one of the most common benchmarking errors in early-stage SaaS.
Our breakdown of SaaS landing page design covers the structural differences that drive these gaps.
What Separates a 2% Page from a 7% Page
The gap between a low-performing and high-performing SaaS page almost always comes down to three things: headline clarity (does the visitor understand what the product does in under five seconds?), social proof placement (is proof visible before the fold?), and CTA specificity.
Pages that say "Start free, no credit card required" consistently outperform pages that say "Get started." The copy does the conversion work. The design supports it.
For practical tactics on building pages that convert, see our guide to landing page conversion best practices.

Trial-to-Paid SaaS Conversion Rate Benchmarks
Trial-to-paid is the conversion metric SaaS operators track most obsessively, and the one that varies the widest. Average SaaS conversion rates for trial-to-paid range from 2% to 25%, depending almost entirely on whether the product relies on self-serve or sales-assisted conversion.
A 5% trial-to-paid rate is healthy for a pure self-serve product. That same 5% rate with a full sales team running every trial signals something has broken somewhere in your process.
The right benchmark is the one that matches your actual motion, not the published industry average.
Research from Lenny Rachitsky's analysis of B2B SaaS conversion data places the median trial-to-paid rate for self-serve products at 3–5%. Sales-assisted products, where a rep touches every trial, average 15–25%, because a human guides the conversion rather than the product doing it alone.
Self-Serve Trial-to-Paid Benchmarks
For self-serve SaaS with a genuinely free trial and no required sales contact, a 3–5% trial-to-paid rate is healthy. Crossing 7% puts you in the top quartile. Sitting below 2% is an onboarding problem, not a pricing problem. The product isn't moving users to their value moment fast enough.
The fastest way to find that drop-off: read our SaaS customer onboarding guide and map the friction points inside your first session.
Sales-Assisted Trial-to-Paid Benchmarks
When a sales rep is involved in every trial, the benchmark shifts sharply upward. A healthy sales-assisted trial-to-paid rate starts at 15% and runs to 25–30% for well-run teams.
If you're sitting below 15% with active sales involvement, the problem is usually trial qualification: too many unqualified users are getting into demos. Review the customer onboarding best practices that help reps run tighter, faster trials.
B2B Sales Funnel Conversion Rate Benchmarks by Stage
For sales-led B2B SaaS, the funnel runs from marketing qualified lead (MQL) to closed-won deal across multiple distinct stages. Understanding b2b sales funnel conversion rates at each stage tells you where your pipeline leaks and where your team has real room to improve.
Across the industry, MQL-to-SQL rates average 13%, SQL-to-opportunity rates average 24%, and opportunity-to-close rates average 27–30%. Multiply those numbers together and the math on your overall funnel efficiency becomes very clear very fast.
Every stage you improve by 5 percentage points compounds through the entire funnel.
According to Salesforce's State of Sales report, the average B2B win rate across industries sits around 21%. HubSpot's conversion rate data places the average MQL-to-customer rate at under 1% when measured from the top of the funnel, which is exactly why stage-by-stage benchmarking beats top-line conversion math every time.
MQL to SQL Conversion Benchmarks
The average MQL-to-SQL rate in B2B SaaS is 13%, according to published Salesforce benchmark data. High-performing teams reach 20–25%. If your rate sits below 8%, the bottleneck is lead quality, not sales performance. Review where your MQLs originate and how strict your qualification criteria actually are before adjusting your sales headcount.
SQL to Opportunity Conversion Benchmarks
Moving a qualified lead into a real, active sales opportunity happens around 24% of the time in mid-market SaaS. Enterprise deals run lower, around 15–18%, because larger buying committees and longer internal processes slow the progression. Improving this rate starts with better discovery calls, not better slide decks.
Opportunity to Close: The Final Mile
Opportunity-to-close rates in B2B SaaS average 27–30%. Enterprise deals close around 20–22%. If your close rate sits below 15%, the issue is usually proposal timing, pricing surprises late in the process, or no internal champion inside the account keeping the deal alive. These are process problems, not product problems.
B2B SaaS Conversion Rate Benchmarks by Industry
Every SaaS industry has different conversion benchmarks. That's why comparing your funnel with similar businesses gives you a more meaningful view of your performance than using one average SaaS benchmark.
Adtech
Adtech SaaS companies often have longer sales cycles and lower top-of-funnel conversion rates because buyers compare multiple platforms before making a decision. Building trust early and generating qualified leads are usually the biggest challenges in this industry.
Automotive
Automotive SaaS companies often sell to manufacturers, dealerships, and fleet operators, which leads to longer buying cycles and multiple decision-makers. Building trust and demonstrating clear business value are important for moving prospects through the sales funnel.
CRM
CRM SaaS products often have higher website conversion rates because buyers are already familiar with the category and many vendors offer free trials. The biggest challenge is helping users experience value quickly enough to convert into paying customers.
Chemical / Pharmaceutical
Chemical and pharmaceutical SaaS companies typically serve enterprise buyers with longer evaluation periods and strict regulatory requirements. As a result, conversion rates at the top of the funnel are usually lower than the SaaS average.
Cybersecurity
Cybersecurity buyers rarely make quick decisions. Before purchasing, they often evaluate security standards, compliance requirements, integrations, and long-term reliability. Because of this, early-stage conversion rates are usually lower, while later sales stages depend heavily on trust and technical validation.
Design
Design SaaS products usually attract high volumes of website traffic because users want to explore the product before making a purchase. The challenge isn't generating interest - it's helping users experience enough value during the trial to become paying customers.
Edtech
Buying decisions in Edtech often involve multiple groups, including educators, administrators, and procurement teams. As a result, converting interest into qualified opportunities can take longer than in many product-led SaaS businesses.
Entertainment
Entertainment SaaS products often attract a large number of visitors, but turning that interest into paying customers can be challenging. Free trials, engaging product experiences, and clear pricing usually have the biggest impact on conversions.
Fintech
Fintech SaaS buyers often spend more time comparing products because security, compliance, and trust are important. As a result, conversion rates may be lower at the beginning of the funnel than in many other SaaS industries.
Hotel & Hospitality
Hotel and hospitality SaaS products often sell to hotels, restaurants, and travel businesses. Buyers usually look for software that is easy to use, integrates with existing systems, and delivers a quick return on investment.
Industrial & IIOT
Industrial and IIoT SaaS companies often work with manufacturers, factories, and industrial businesses. Buying decisions usually take longer because companies need reliable software that integrates with existing systems.
Insurance
Insurance SaaS products often serve insurance providers, brokers, and financial organizations. Trust, compliance, and data security play an important role throughout the buying process.
Legaltech
Legaltech SaaS products help law firms and legal teams manage documents, compliance, and legal workflows. Buyers usually spend more time evaluating software because accuracy, security, and reliability are essential.
Medtech
Medtech SaaS products support healthcare providers, medical device companies, and life sciences organizations. Buyers often look for secure, compliant software that improves patient care and operational efficiency.
Project Management
Project management SaaS products are popular with businesses of all sizes, making the market highly competitive. Most buyers compare several tools before choosing one that fits their team's workflow.
Retail / eCommerce
Retail and eCommerce SaaS products help businesses manage online stores, inventory, payments, and customer experiences. Buyers usually expect quick setup, easy integrations, and fast results before making a purchase.
What is a Good Funnel Conversion Rate? The Right Way to Answer This
"What is a good funnel conversion rate?" is the right question asked the wrong way. The correct version is: what is a good rate for your specific funnel stage, your business model, your deal size, and your current traffic mix? A 3% trial-to-paid rate can be excellent or it can be a sign your onboarding is failing, depending on every variable your specific business carries into that number.
Good is not a number. Good is beating the products your buyers actually compare you to.
The fastest calibration: identify three direct competitors at the same price point and same sales motion, then work backward from their public conversion signals or from discovery calls where prospects mention them. That comparison is always more actionable than a published industry table.
Tip: Run this check before accepting any benchmark as your baseline. Ask your last 10 churned trial users why they did not convert. If more than 3 of 10 say the same thing, you've found your real benchmark problem. It is almost never a pricing issue.
When you have that answer, the next question is always about the experience those users had in the product. Start with SaaS UX redesign for conversions to understand which design changes move conversion rates the fastest.
How to Measure Your B2B SaaS Conversion Rates Without Distorting the Data
Measuring b2b saas conversion rates incorrectly is how founders end up spending sprints optimizing the wrong part of the funnel. Three errors appear in nearly every SaaS analytics setup we've reviewed: counting total visitors instead of qualified visitors in the denominator, measuring trial starts instead of activated users, and using vanity proxies like page views or session count as a signal of real intent.
What you measure determines what you fix: getting the denominator right matters more than the numerator.
A trial-to-paid rate calculated on all trial signups tells a different story than one calculated on users who completed activation and reached the product's core value moment. The second number is the one worth improving, because users who never activated were never viable conversions in the first place.
The Right Denominator for Each Funnel Stage
Use qualified visitors, not all visitors, for website conversion rates. Use activated users, not all signups, for trial-to-paid rates. Use opportunities with a documented next step, not all SQLs, for close rates. Each stage's denominator needs to filter for genuine intent. That filtering separates a useful benchmark from a misleading one.
Understanding what "qualified" means at each stage starts with a clear picture of your SaaS website best practices and how the site filters for buyer intent before a visitor ever hits your trial flow.
Multi-Touch Attribution and Where Conversion Data Breaks Down
Multi-touch attribution is the point where most SaaS conversion analytics quietly fall apart. A user clicks a blog post, returns three days later via direct, then converts on a retargeting ad. Single-touch models credit the ad. First-touch models credit the blog. Neither tells the full story.
Use a linear or time-decay attribution model when your sales cycle runs longer than 14 days. Without it, your conversion data will point spend toward the last click, not toward the content and channels that actually created the buyer. Reforge's product-led growth resources and Nielsen Norman Group's research on digital conversion behavior both cover these trade-offs well for product-led and sales-led teams.
What Actually Improves B2B SaaS Conversion Rates
Knowing your b2b saas funnel conversion benchmarks is step one. Knowing which specific levers actually move those numbers is where the real work begins. Across the patterns we see when auditing SaaS products, the improvements that move saas conversion rates most are not full redesigns. They are structural changes to three areas: the first-session experience, the pricing page, and the sign-up flow.
The fastest conversion win in SaaS is almost always reducing time-to-value, not redesigning the homepage.
At Orbix Studio, the pattern we see consistently is founders investing heavily in top-of-funnel design while the trial flow quietly loses 60% of users before those users ever experience the product's core value. A polished marketing site does nothing for a broken activation experience.
Onboarding Is Where Most SaaS Trials Die
The largest leak in most SaaS funnels sits inside the first 72 hours of a trial. Users who don't reach the product's core value within three days rarely convert to paid. Slack and Notion solved this by eliminating setup friction before the user ever sees a feature. The goal is not a feature tour. It's one moment of genuine value, delivered as fast as possible.
Review the SaaS customer onboarding checklist to identify which steps in your current flow add friction without adding perceived value.
Pricing Page Design Has an Outsized Impact on SaaS Conversion
The pricing page is the highest-intent page on any SaaS website, and it's the page founders invest in least. Research from Paddle (formerly ProfitWell) shows that teams actively testing their pricing pages see 11–30% higher conversion rates than those treating it as static content. Three variables do most of the work: plan count (three plans is the proven sweet spot for B2B), anchor pricing using the highest tier, and clear feature differentiation between tiers that makes the choice feel obvious rather than forced.
Reducing Friction in the Sign-Up Flow Directly Lifts Conversion
Every field you add to a sign-up form costs you approximately 5% of completions, according to research from Formisimo's form conversion studies. A seven-field form converts roughly 40% fewer users than a three-field form, all else equal. For B2B SaaS, the minimum viable sign-up is email, company name, and role. Every additional field needs to justify its presence in conversion terms, not in data-collection terms.
The UX decisions behind form design and activation flows are covered in full in our SaaS UX design guide.
Common Mistakes When Reading SaaS Conversion Benchmarks
Misreading b2b saas conversion rate benchmarks is more common than ignoring them entirely. The benchmarks exist, but they get applied to the wrong stage, the wrong business model, or the wrong comparison set. The resulting decisions waste months of engineering and design capacity on problems that weren't actually there.
The most expensive benchmarking mistake: applying a self-serve benchmark to a sales-led product and concluding the product is the problem.
Three specific errors show up repeatedly.
Mixing Free Trial and Freemium Benchmarks
A freemium product converting 3% of free users to paid carries a completely different profile than a time-limited trial converting 3%. Freemium is designed around network effects and a large, permanent free base. A low conversion rate is built into the model, not a sign of failure. Treating a freemium conversion rate with trial-to-paid benchmarks will make a healthy product look broken.
Ignoring Traffic Quality in Website Conversion Rates
A SaaS site converting 2% of all traffic might be converting 9% of organic search traffic and 0.5% of paid display traffic. Blending those into a single rate hides the truth entirely. Segment your conversion rate by traffic source before comparing it to any benchmark, because the mix of sources in published benchmarks may be nothing like yours.
For a broader picture of how UX quality affects conversion across the traffic funnel, see our breakdown of conversion rate optimization principles.
Optimizing Conversion Without Measuring Retention
A 15% trial-to-paid rate looks strong until you discover 60% of those customers churn in month two. High conversion paired with high early churn means you're converting the wrong users: users who were interested enough to pay but not engaged enough to stay. The metric worth optimizing is trial-to-retained customer, not just trial-to-paid.
Reducing customer churn through UX design shows the specific product changes that keep converted users active past the critical first 60 days.
B2B SaaS Funnel Conversion Benchmarks: Reference Table
Here is a consolidated reference breakdown of b2b saas funnel conversion benchmarks by stage and business model, built from published data across OpenView Partners' SaaS benchmarks, Salesforce State of Sales, HubSpot conversion research, and Lenny Rachitsky's B2B SaaS analysis.
Use this table as a calibration starting point, not a verdict. Your actual benchmark should be built from your own segmented data, broken down by traffic source, deal size, and sales motion, before any industry number is applied to it.
How Product and UX Design Directly Drive SaaS Conversion Rates
Conversion rate problems in SaaS are UX and product design problems far more often than they are messaging or pricing problems. A confusing onboarding flow, a dashboard that buries the product's value, or a pricing page with four competing CTAs. These are not abstract product strategy issues. They are specific, fixable design problems. And they move fast when the right designer touches them.
The biggest design investment that moves sales conversion rates is not the marketing site. It's the first-session product experience.
SaaS companies that treat product design as a conversion lever, not an aesthetic exercise, consistently see 15–30% conversion lifts from well-structured redesigns. The starting point is always the same: not "what looks bad" but "where do users stop progressing?" Those are different questions with different answers.
A product that looks polished but fails to guide users to value is a beautiful dead end. The B2B SaaS dashboard design examples and SaaS dashboard design guide both show what "guiding users to value" looks like in practice at the product level.
If your SaaS conversion rates are below benchmark and you're ready to move them, Orbix Studio's SaaS design services work directly on the product experience changes that drive activation and trial-to-paid improvements.
Frequently Asked Questions
What is the average B2B SaaS conversion rate?
The average B2B SaaS trial-to-paid conversion rate is 2–5% for self-serve products and 15–25% for sales-assisted products. Website-to-trial rates average 2–5% across the industry. These numbers shift based on business model, deal size, and traffic source, so use them as a starting range rather than a fixed target.
What is a good funnel conversion rate for SaaS?
A good funnel conversion rate depends on your stage and motion. For self-serve SaaS, 5%+ trial-to-paid is strong. For sales-led products, 20%+ is a healthy benchmark. Website conversion above 4% sits in the top quartile for B2B SaaS. Always benchmark against your own competitors at the same price point, not a generic industry average.
What are average B2B sales funnel conversion rates by stage?
MQL-to-SQL averages 13% across B2B SaaS. SQL-to-opportunity averages 24%. Opportunity-to-close averages 27–30%. Top-performing teams beat each of these by 5–10 percentage points through tighter lead qualification and more structured discovery processes. Enterprise deals run 20–30% lower at every stage due to buying committee size.
How do SaaS conversion rates differ by pricing model?
Free trial, freemium, and demo-first products run completely different benchmarks. Time-limited free trials convert 3–15% to paid. Freemium products convert 2–5% of free users to paid over time. Demo-first products close 20–35% of qualified demos. Mixing these benchmarks leads to wrong conclusions about where a product is actually underperforming.
What kills SaaS trial-to-paid conversion rates the most?
The three biggest killers are: users not reaching the product's core value moment in the first session, an onboarding flow that requires too much setup before showing any value, and a pricing gap where the free tier is too generous and the first paid tier feels like too large a jump. All three are fixable through design and UX changes faster than through pricing restructures.
How does deal size affect B2B SaaS conversion rates?
Higher ACV deals consistently carry lower conversion rates at every stage, and that is expected and healthy. A $500/month SMB deal might close at 35%. A $50,000/year enterprise deal closes at 18–22%. The lower rate reflects buying committee size and process complexity, not product quality or pitch effectiveness. Comparing these two is a structural benchmarking error.
How often should I benchmark my SaaS conversion rates?
Review conversion rates by funnel stage monthly and benchmark against industry data quarterly. A single month of data carries too much variance to act on confidently. Quarterly reviews give you enough data to spot real trends and enough time to implement changes and measure their impact before the next review cycle.
Conclusion
No universal benchmark exists for B2B SaaS conversion rates. The number that matters is the one measured at the right stage, compared against the right model, with the right denominator, and then compared against the products your buyers actually consider alongside you.
Pick one funnel stage that matters to your business right now, measure it correctly for 30 days, and compare it against the benchmark range that fits your model and deal size. That single exercise will surface more about where to focus than any published industry report.
Want a second set of eyes on your funnel? Orbix Studio works with SaaS founders on the product design and UX changes that move activation and conversion rates. Explore SaaS design services


.avif)
